- "루머 해소됐나 했더니"…알테오젠 개미들 또다시 '한숨'
- 알테오젠 주가가 급반등 하루 만에 다시 급락하고 있다. 26일 오전 10시9분 현재 알테오젠 주가는 전일 대비 4.98% 내린 31만4500원에 거래되고 있다. 알테오젠은 이날 장 초반 한때 주가가 7.1%까지 떨어

.
Recently, KOSDAQ's top market cap stocks such as Alteogen and Ligachembio, which had maintained a strong upward trend, have shown significant fluctuations.
Today, the stock market showed a lackluster performance, again exhibiting a downward trend. Alteogen seems to be heavily impacted after a recent patent dispute issue emerged.
Rather than the recent significant decline in these stocks, it's more noteworthy that they have begun to break the 60-day moving average support trend that had been maintained for a considerable period.
Looking at the daily charts of Alteogen and Ligachembio below, although there were instances of slight deviations from the 60-day moving average during the past year, this is the first time they have significantly renewed the previous low divergence.
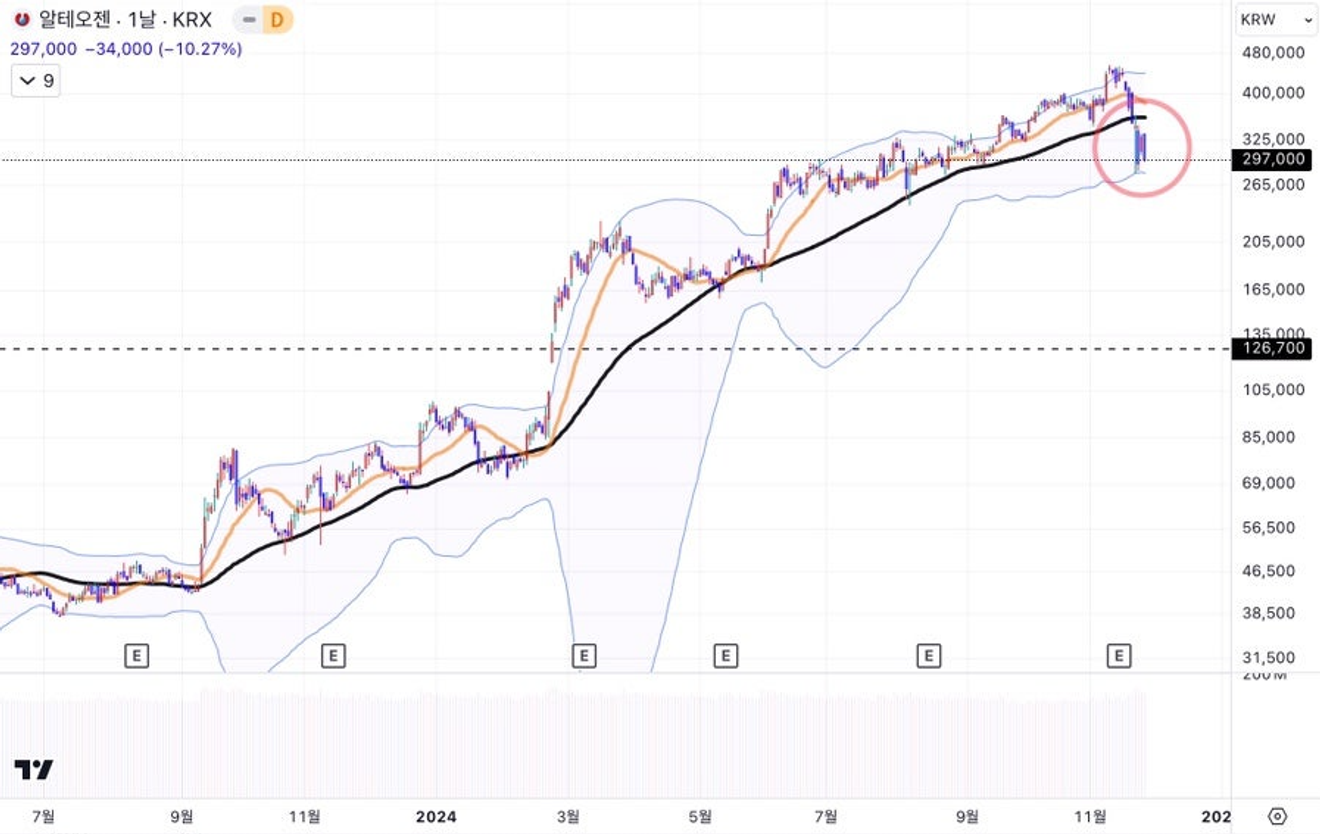
Alteogen Daily Chart
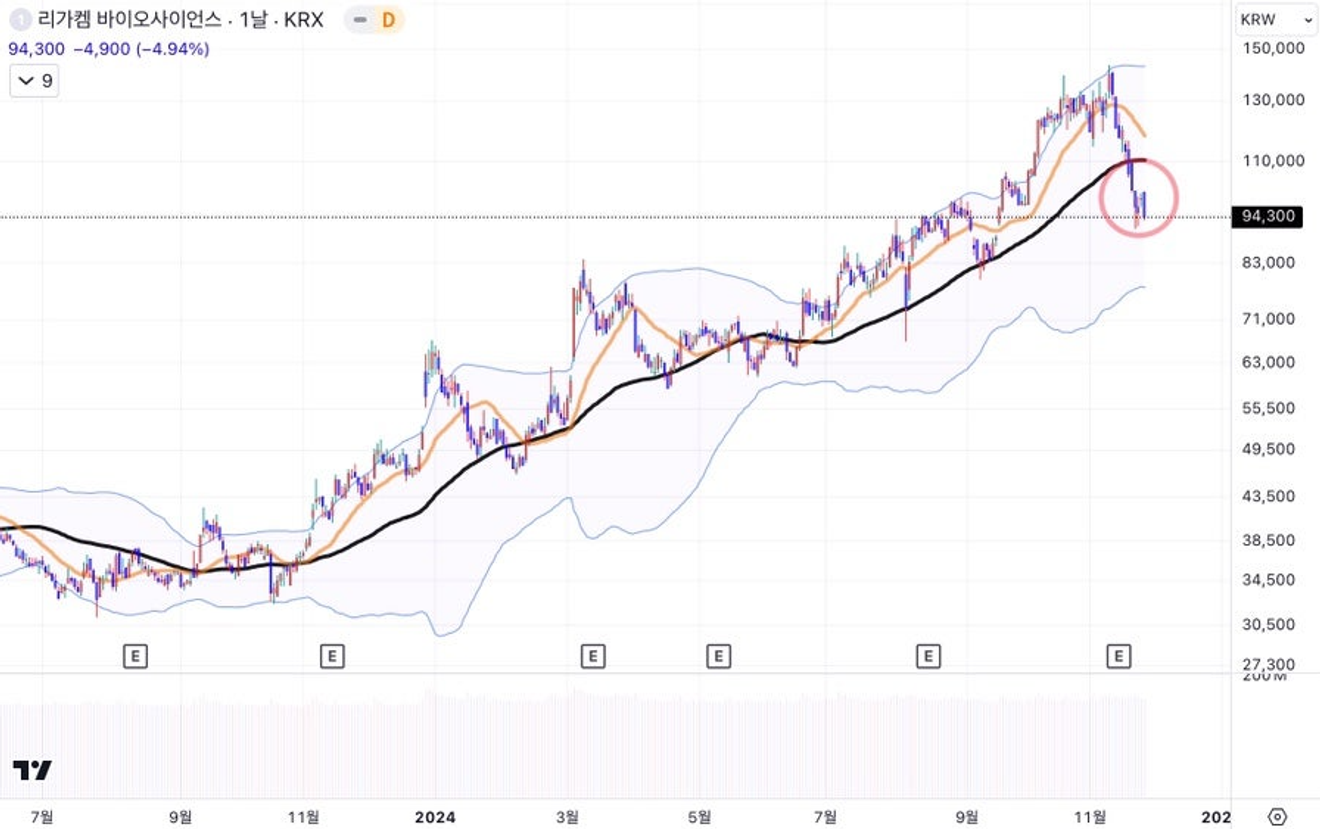
Ligachembio Daily Chart
Existing Alteogen holders, even when faced with the patent dispute issue leading to such a decline, often dismiss it as "just a rumor" due to factors like ownership bias.
However, when a stock that has shown a strong trend for a considerable period, perhaps somewhat suspiciously like a pump-and-dump scheme, shows a clear break in the trend, past experiences indicate that the rumor may not have been a rumor, hence caution is advised.
Those who believe the trend has broken will likely look at a longer-term chart, like the weekly chart below, anticipating support to appear only at previous highs.
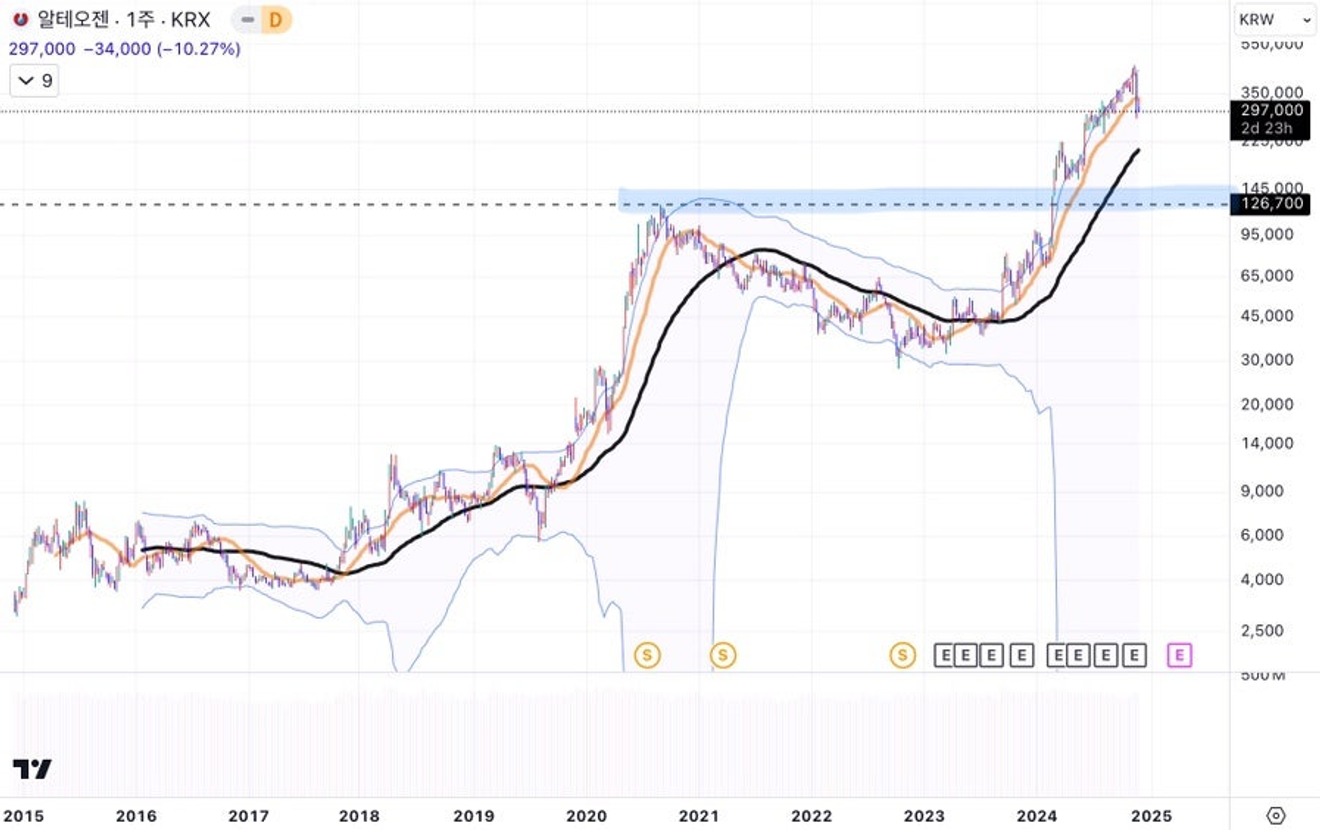
Alteogen Weekly Chart
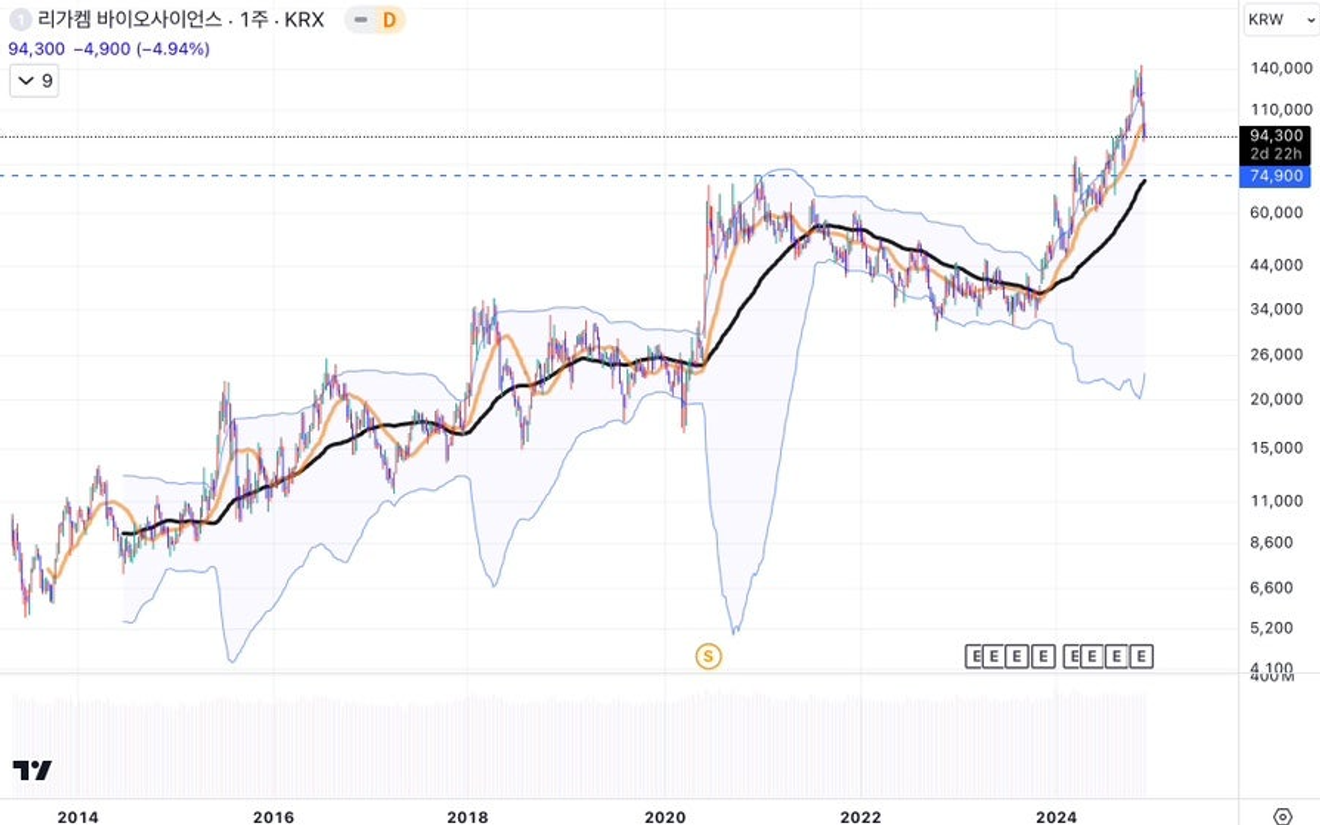
Ligachembio Weekly Chart
From an individual stock perspective, given Alteogen and Ligachembio's promising future and their significant market capitalization within KOSDAQ, one might believe they are highly valued and will remain so. However, from a market (index) perspective, it is possible that foreign investors and institutions have driven up these stocks as a "replacement" for other previously successful top market cap stocks like Ecopro and Ecopro BM, which have recently weakened, to support the overall index.
While the future of individual stocks is uncertain, the possibility of them being used as replacements should be considered.
The fact that other top KOSDAQ market cap stocks such as Ecopro, Ecopro BM, and HLB rebounded while Alteogen and Ligachembio declined over the past two weeks supports this possibility.
In such cases, top market cap stocks often engage in a "market cap seesaw game".
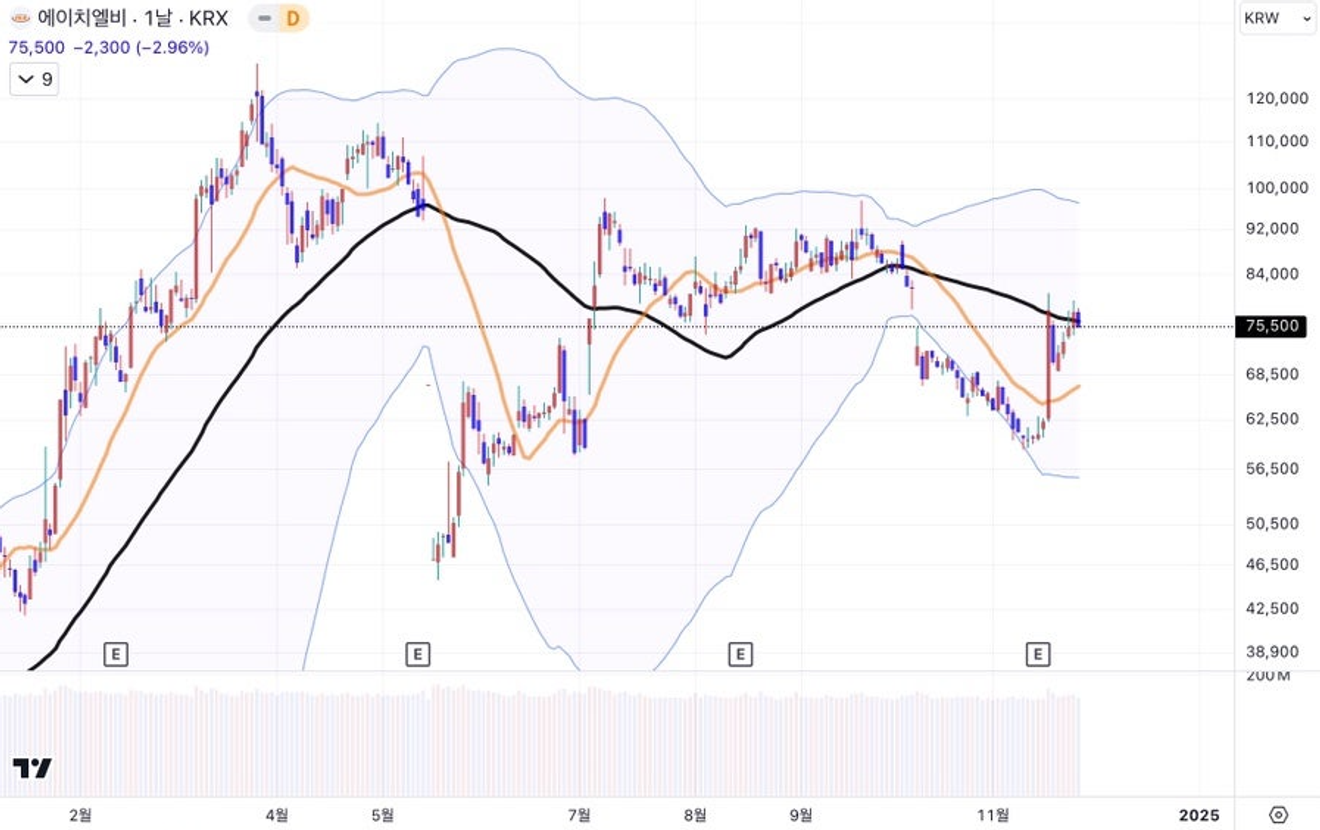
HLB Daily Chart
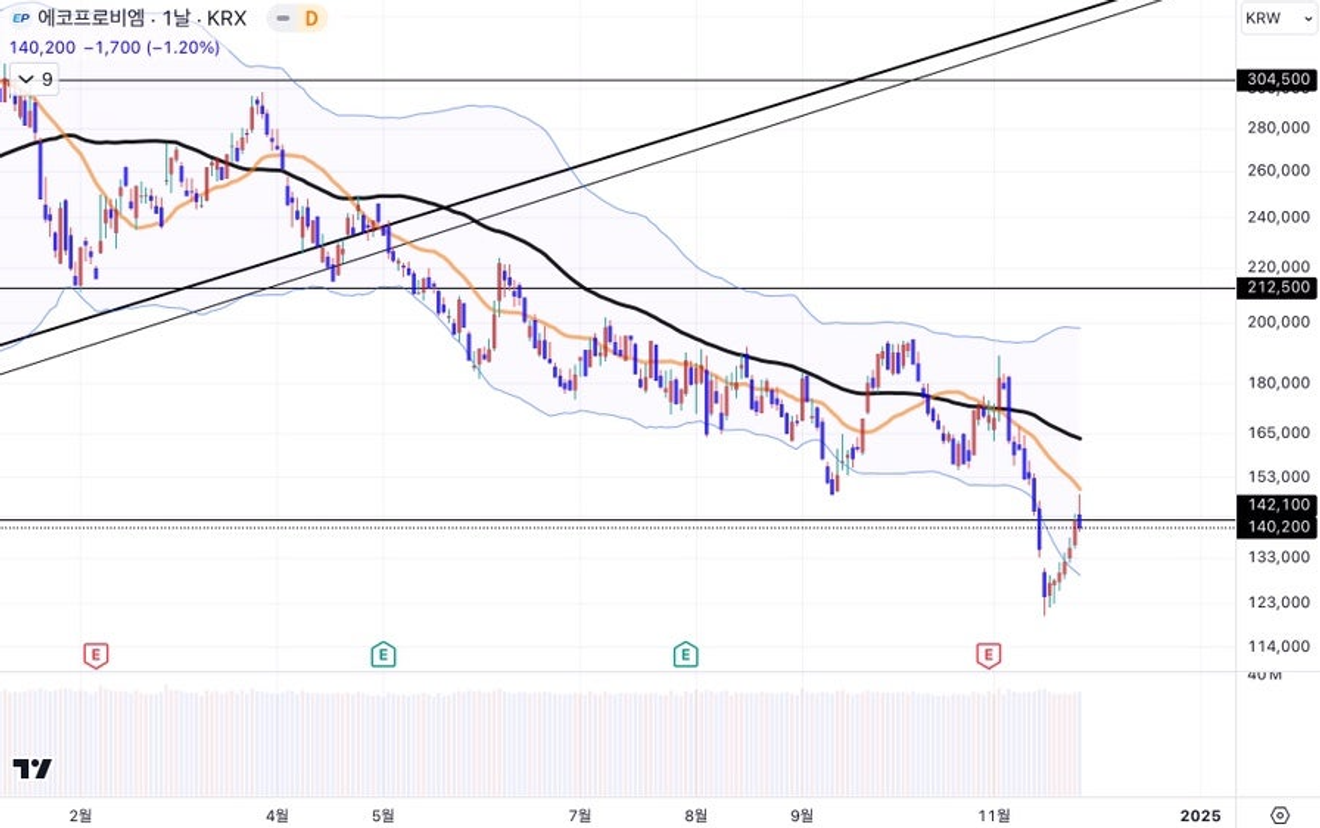
Ecopro BM Daily Chart
From an index perspective, as shown in the daily KOSPI index chart below, it is necessary to carefully observe whether this trend continues until early next year.
Since Samsung Electronics' share buyback seems to have established a bottom, there is a possibility of a rebound rally until the end of the year, but it remains to be seen if it will turn downward again from early next year.
Currently, this possibility is considered high, and if this trend unfolds, the market in the first half of next year could be significantly harsh, affecting both the domestic and US stock markets.
If top market cap stocks that previously maintained a strong upward trend, such as Alteogen and Ligachembio, begin to show this pattern at this point, it is necessary to approach the situation cautiously and question the assumptions. Simply holding onto them due to ownership bias could be problematic.
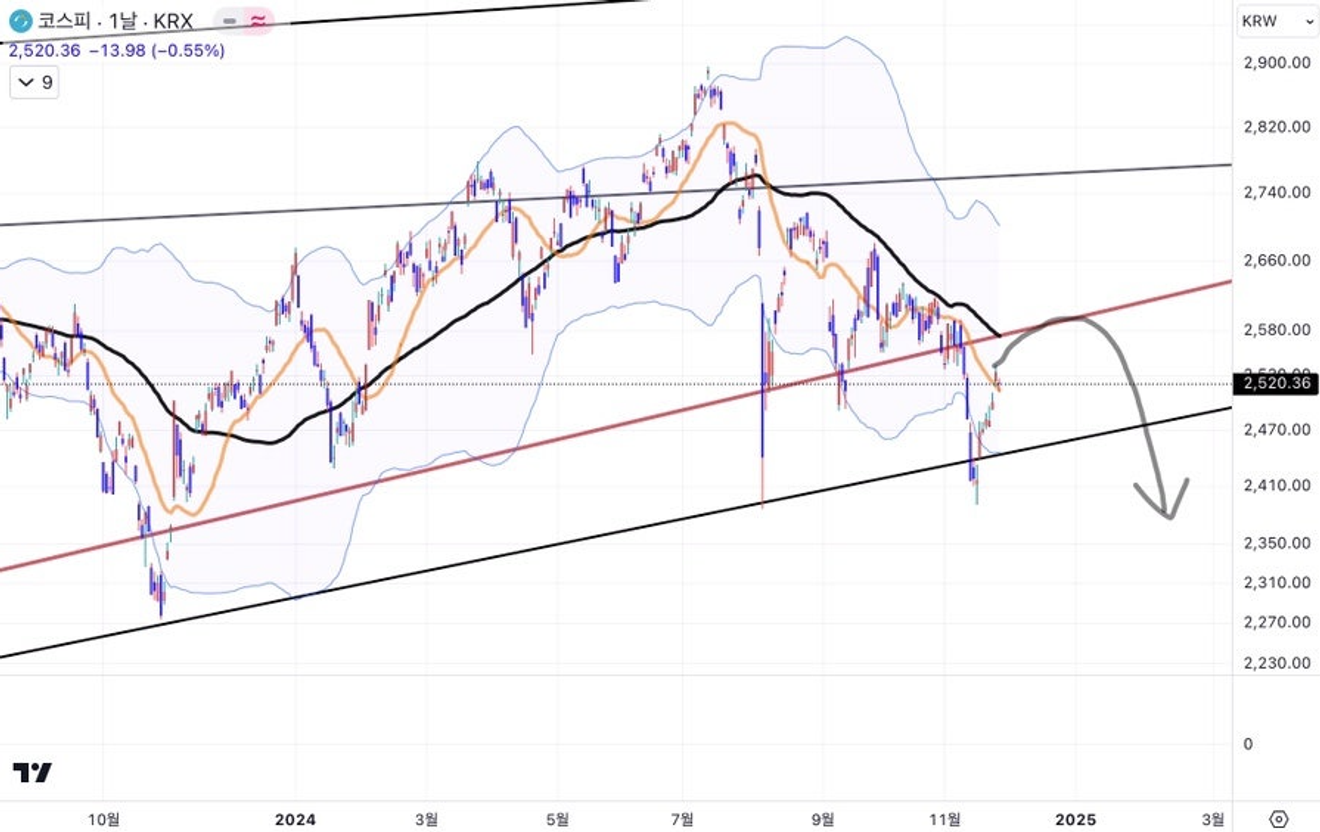
KOSPI Daily Chart
The concern about this trend in the KOSPI index shown above is due to the support level position in the long-term chart shown in the monthly chart below.
It seems that even from a medium-to-long-term perspective, the KOSPI index's support is weakening.
And if it breaks through again and falls further...?
It suggests that the market in next year could be even gloomier than this year.
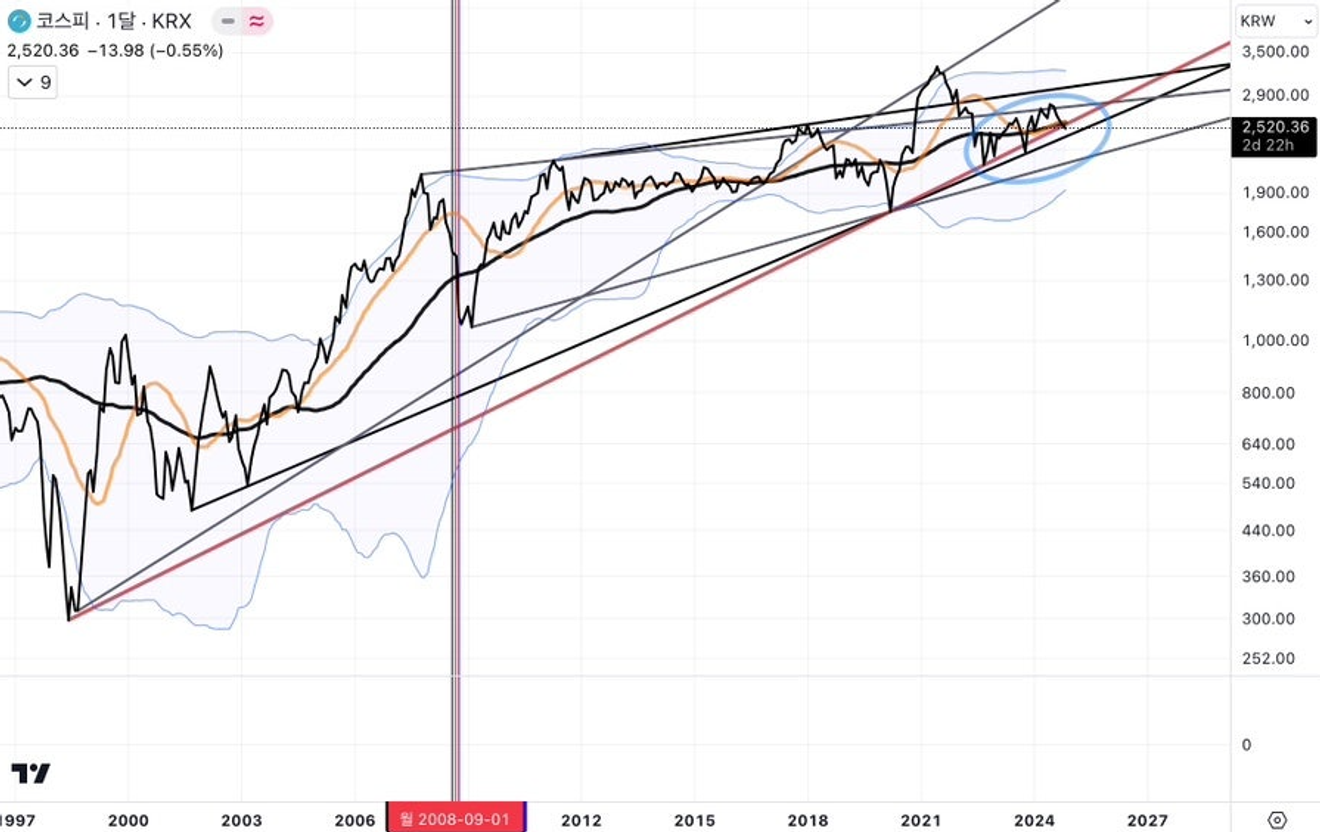
KOSPI Monthly Chart
If this KOSPI index trend, as seen above, is linked to the KOSDAQ index, it will likely follow a similar trajectory, although the volatility may differ.
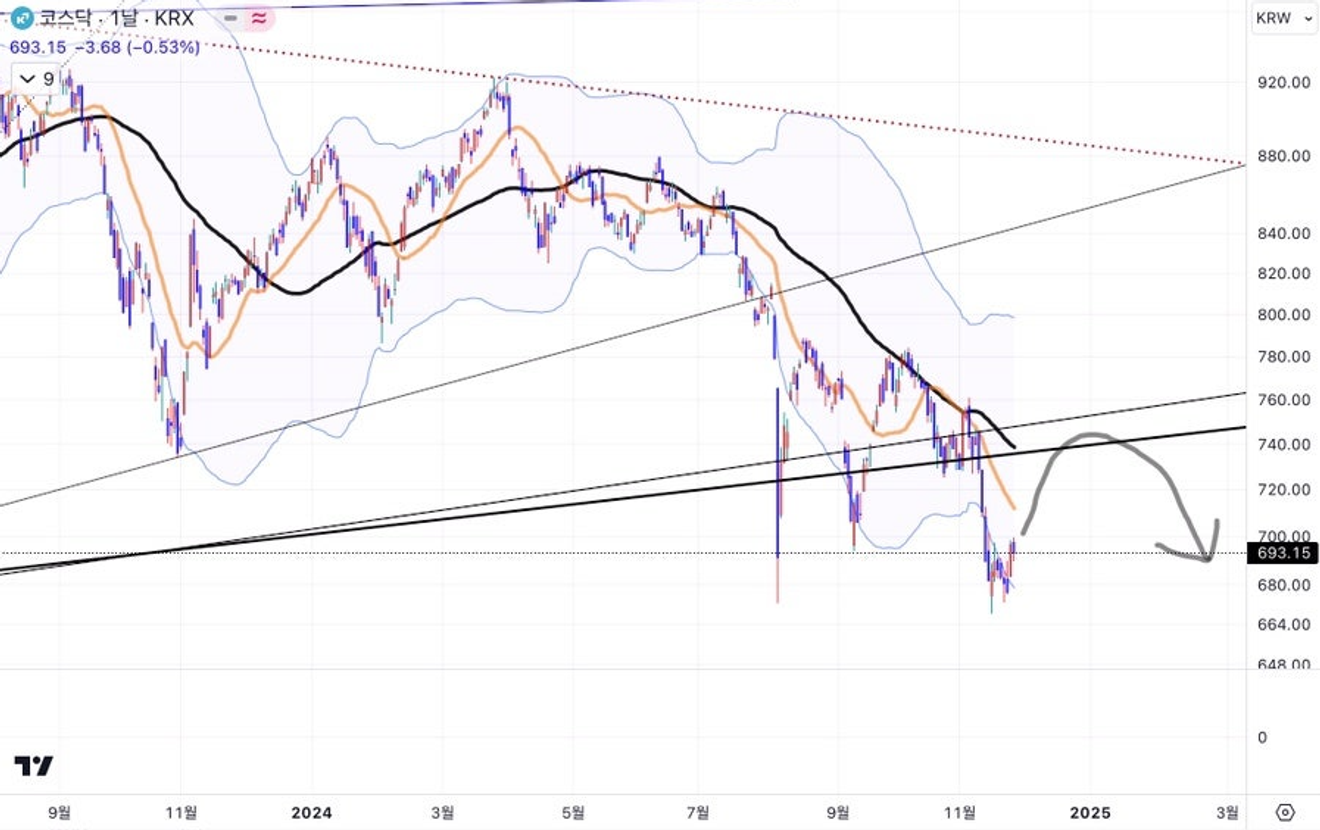
KOSDAQ Daily Chart
It's becoming increasingly urgent to address this, as if a recessionary trend emerges in the US economy within the next few months, it could signal the beginning of a significant risk period in the market starting next year.
Next year might mark the beginning of a full-blown global economic depression.
While various news items serve as excuses for market indicators, it's crucial to analyze the trends in US Treasury market interest rates, gold prices, etc., to assess one's economic and investment risks. It's time to evaluate those.
It's better to be proactive; heed warning signs during periods of anticipated rebound.
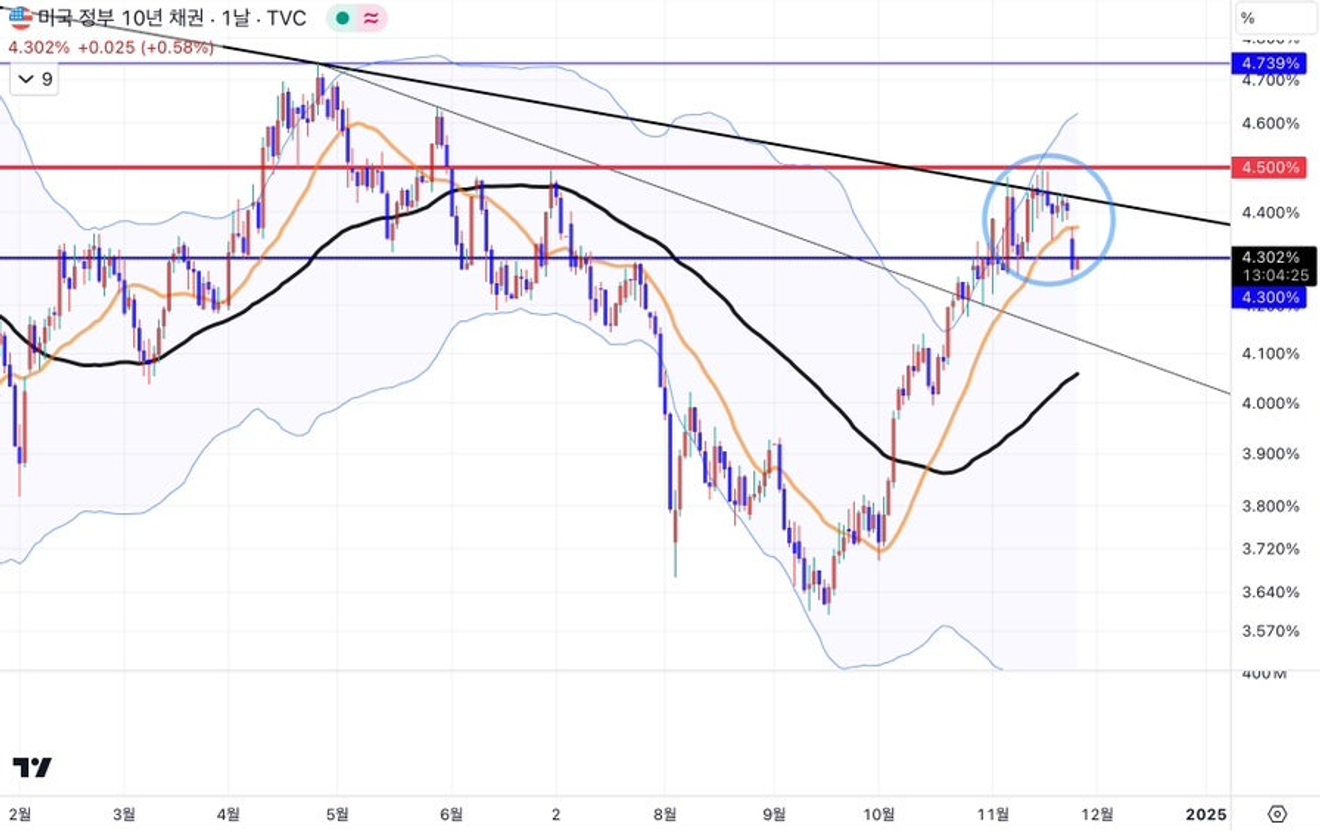
US 10-Year Treasury Yield
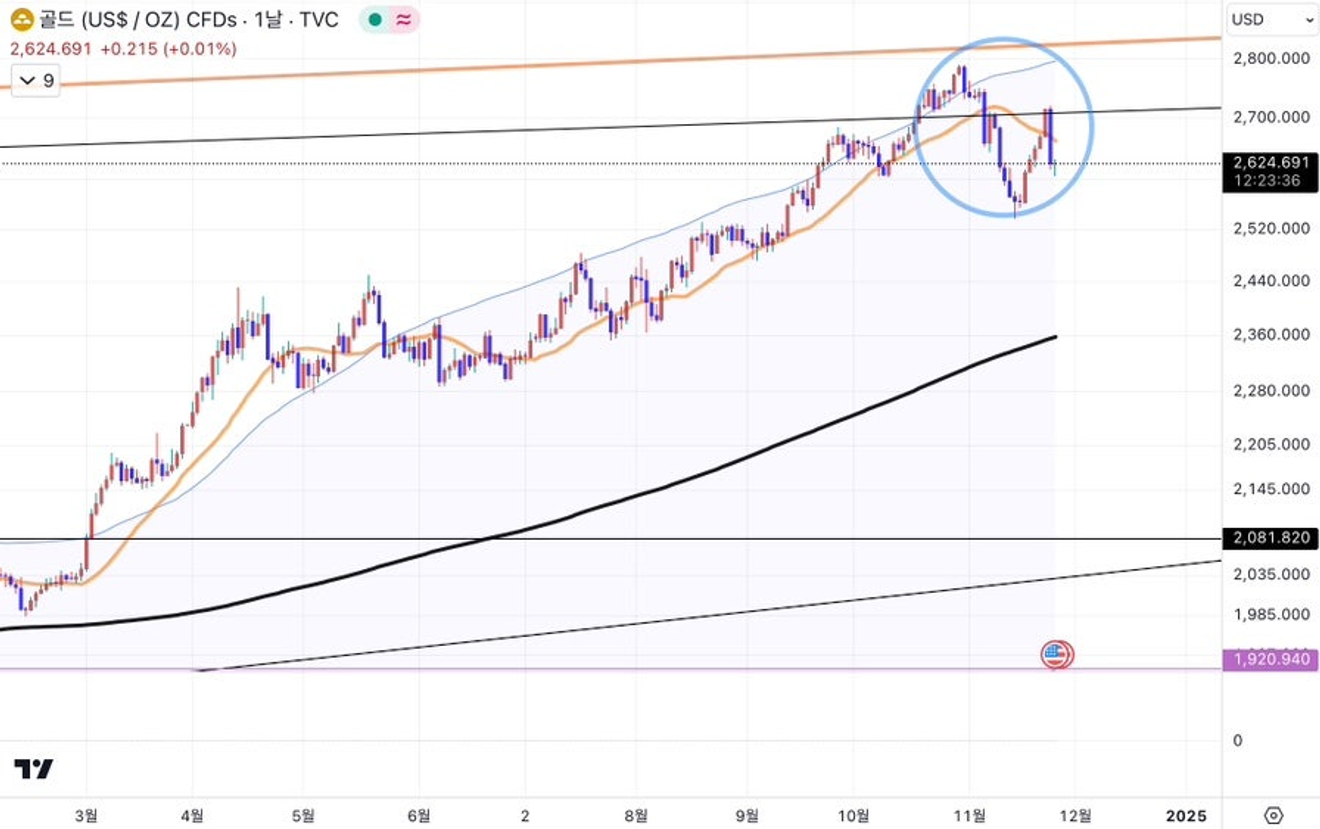
Gold Price Daily Chart
Comments0