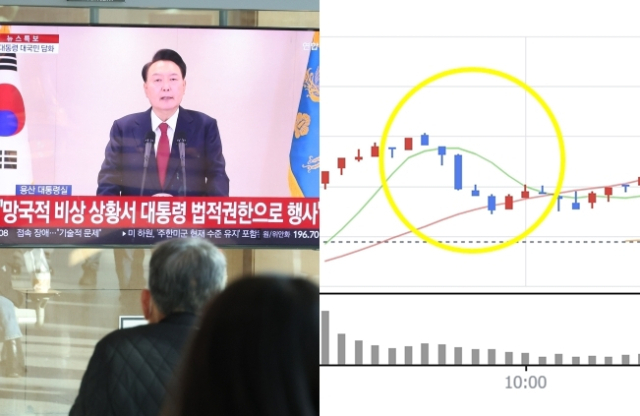
- 코스피 장 막판 '尹탄핵 찬성 여론' 읽고 상승세로 마감?
- 양쪽으로 갈라진 정치가 답을 모르면 그 답은 경제가 알려주는 경우가 종종 있다. 12일 코스피가 그런 모습을 보였다. 한국거래소에 따르면 이날 코스피 지수는 전일 대비 1.62%(39.61포인트(p)) 오른 2482

.
Today, the domestic stock market briefly flinched in the morning due to a statement issue, but as the latter half of the trading session progressed, the market seemed to anticipate the possibility of an impeachment vote, resulting in a rise and a positive closing.
The KOSPI closed up 1.62%, and the KOSDAQ closed up 1.10%. Foreign investors are still maintaining net selling, although the selling pressure isn't intensifying.
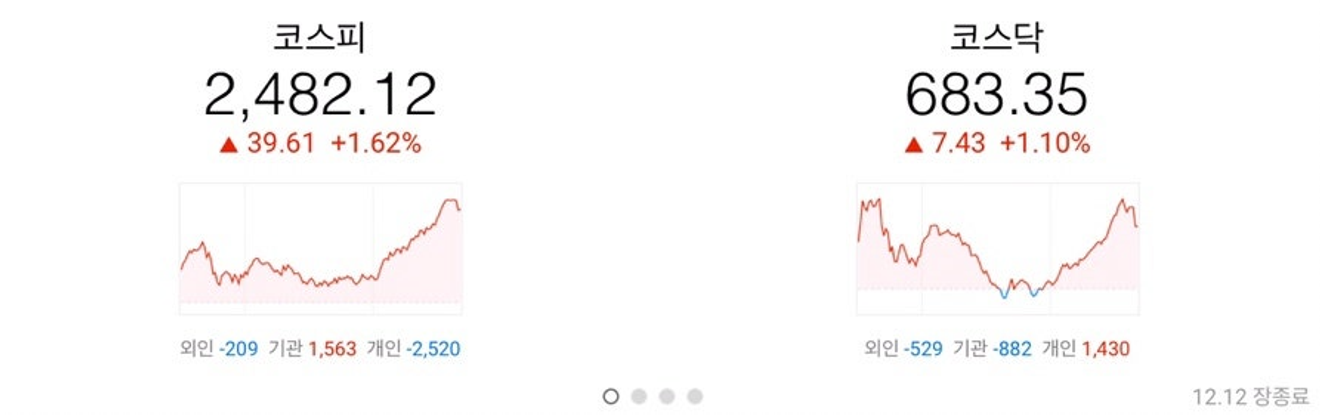
KOSPI, KOSDAQ Intraday Trend
Before the events of last week, the initial expectation was that the domestic stock market would continue its upward trend until the end of the year. However, the events of last week have thrown the domestic market into a chaotic state, making its future direction unpredictable.
We currently view the current upward trend in the domestic stock market not as the beginning of a sustained rise, but rather as a "period of potential short-term rebound".
The situation remains essentially unchanged. We believe this is because, starting next year, the US economy is expected to enter a period of slowdown, potentially leading to a global recession.
Therefore, for the KOSPI index, the area marked in blue below is likely to act as resistance. If uncertainty decreases further and the rebound intensifies, approaching that line, long-term investors might consider reducing their holdings and observing the situation next year.
Long-term investors, as opposed to short-term or swing traders, may want to reduce their holdings and wait for opportunities in the second half of next year or later.
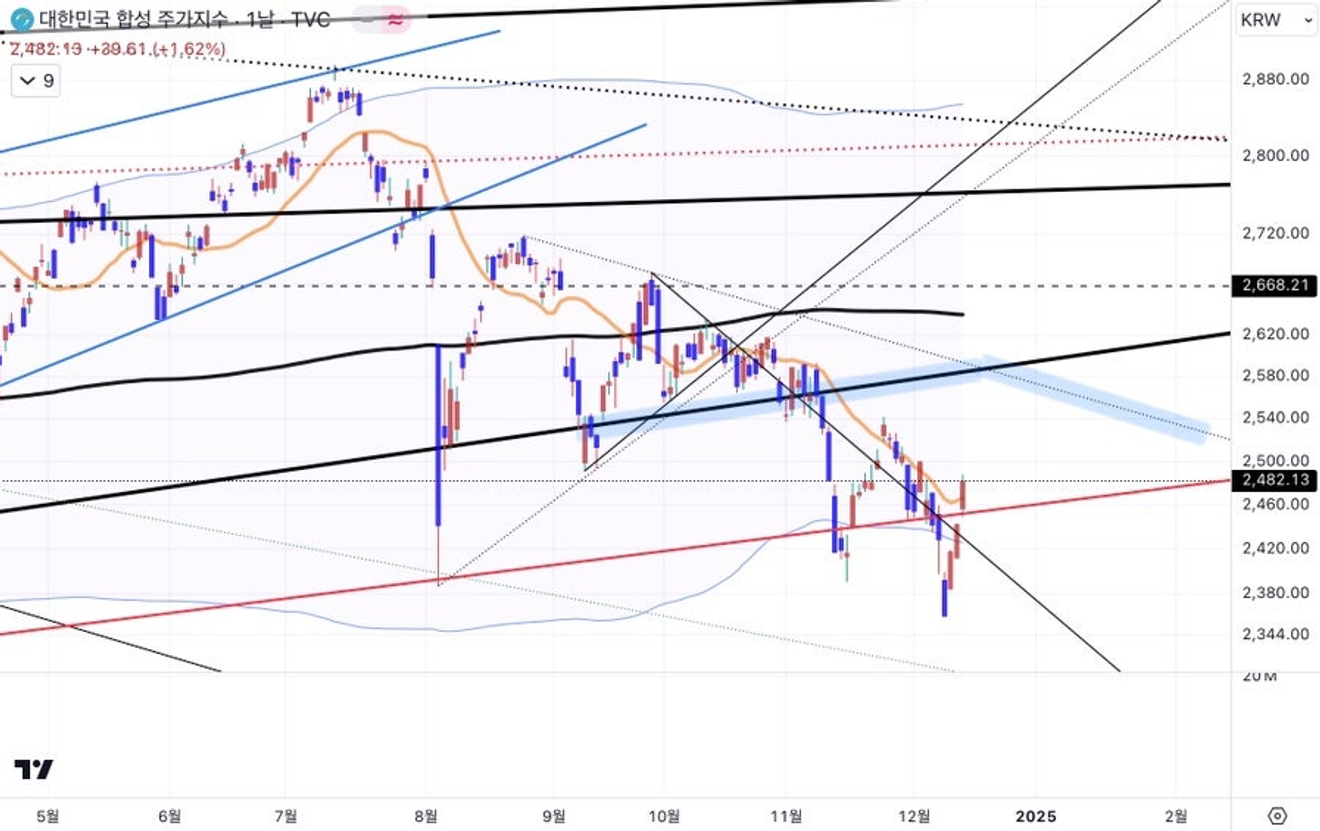
KOSPI Index
The KOSDAQ index shows a similar trend. We believe it will be difficult for the KOSDAQ to quickly surpass this resistance line, and therefore, if the index approaches this level around the end of the year and the beginning of the next, reducing holdings would be advisable.
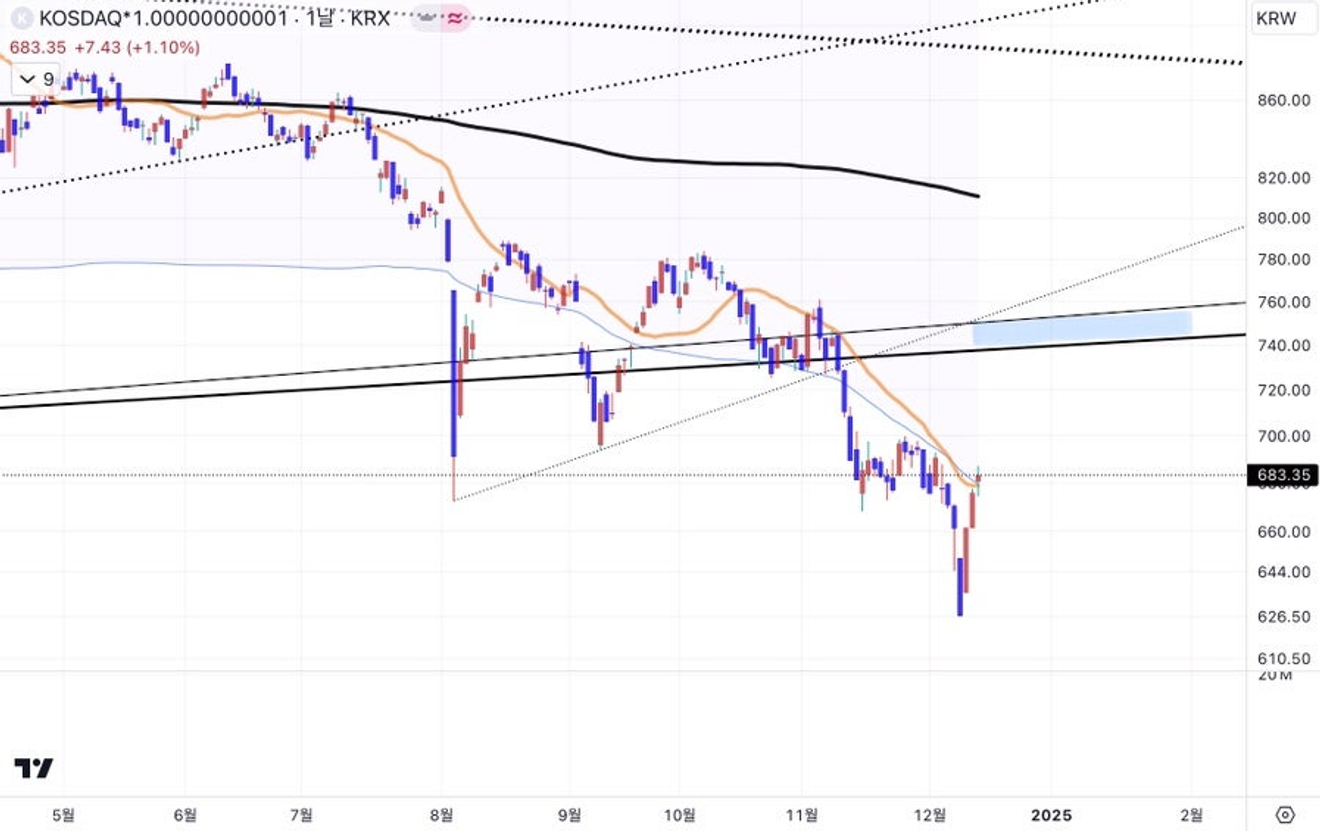
KOSDAQ Index
The following charts show the long-term monthly charts of major domestic companies. These are well-known leading companies in the technology sector, but there are some differences in the long-term price chart trends.
Samsung Electronics and SK Hynix, leading companies in the semiconductor sector. Of the two, SK Hynix's performance appears significantly better.
Hynix experienced a risky period in 2022 in the long term, but after the emergence of ChatGPT, it swept up the supply of HBM used in AI semiconductors, showing a difficult-to-achieve return to the long-term trend. This shows HBM’s contribution to SK Hynix’s success.
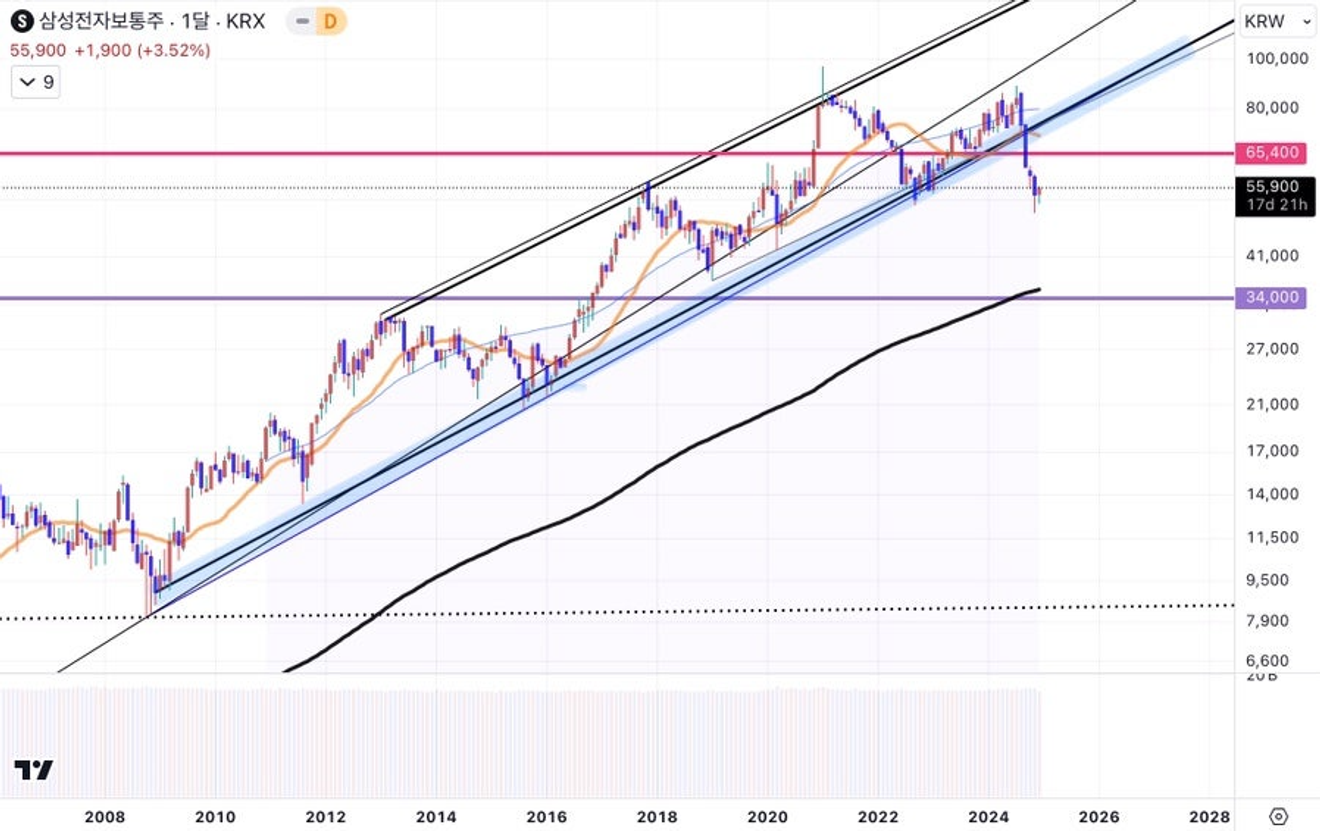
Samsung Electronics Monthly Chart
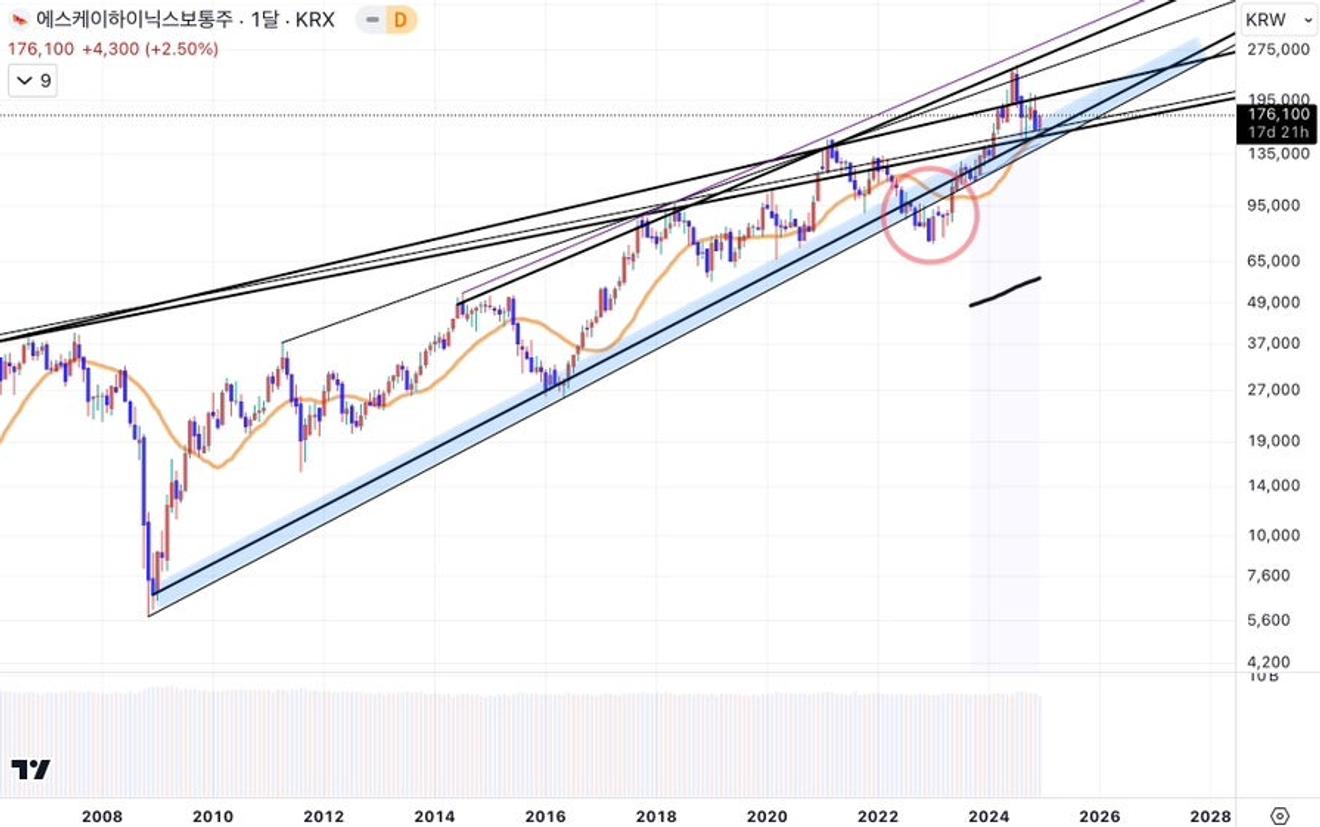
SK Hynix Monthly Chart
And Naver, a leading IT company. While it has recently experienced a significant rebound, its long-term price trend seems similar to that of Samsung Electronics.
For Naver's price chart to return to the trend line like SK Hynix did in 22-23, a breakthrough service that generates significant revenue is needed...Perhaps the LINE messenger service, which is reportedly gaining popularity in the US?
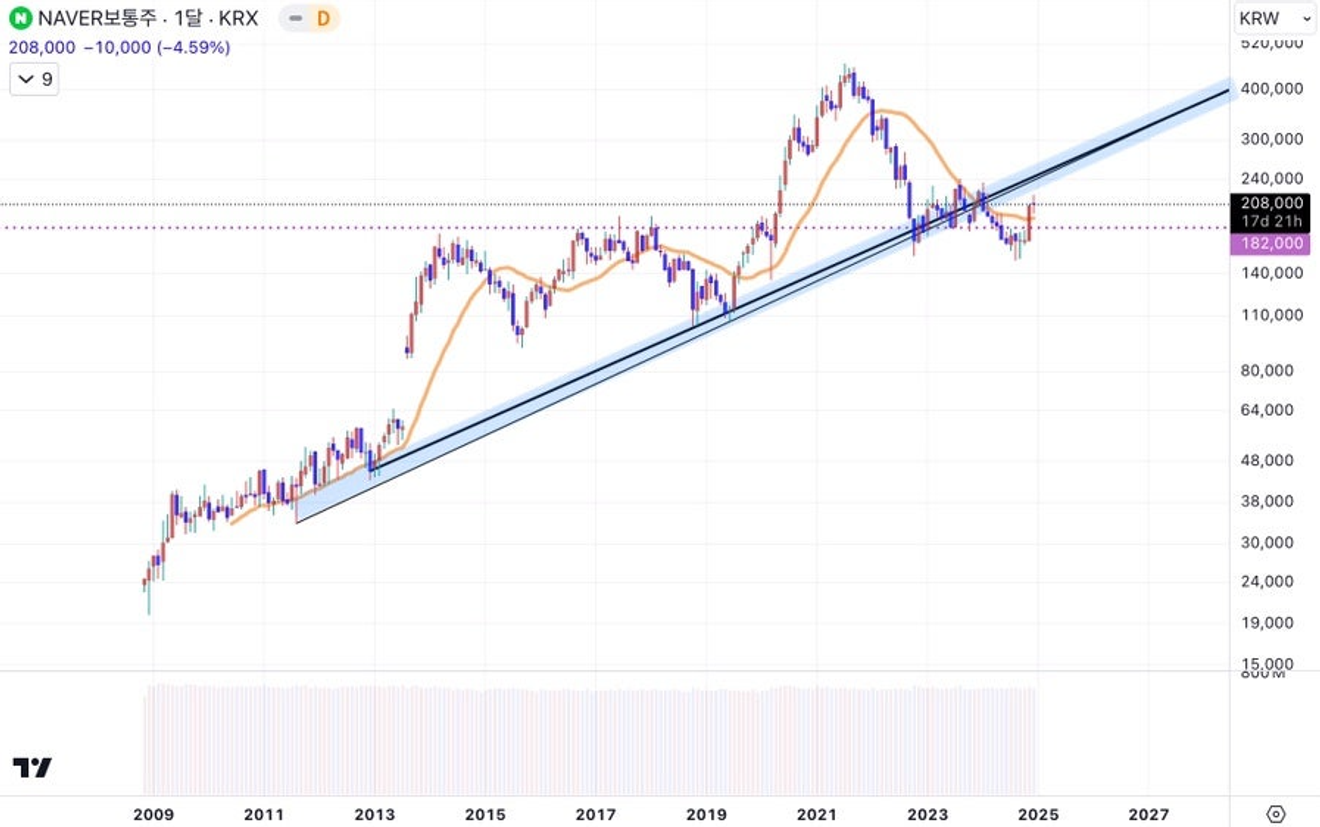
NAVER Monthly Chart
And the price trends of Hyundai Motor and Kia, domestic and global automobile companies.
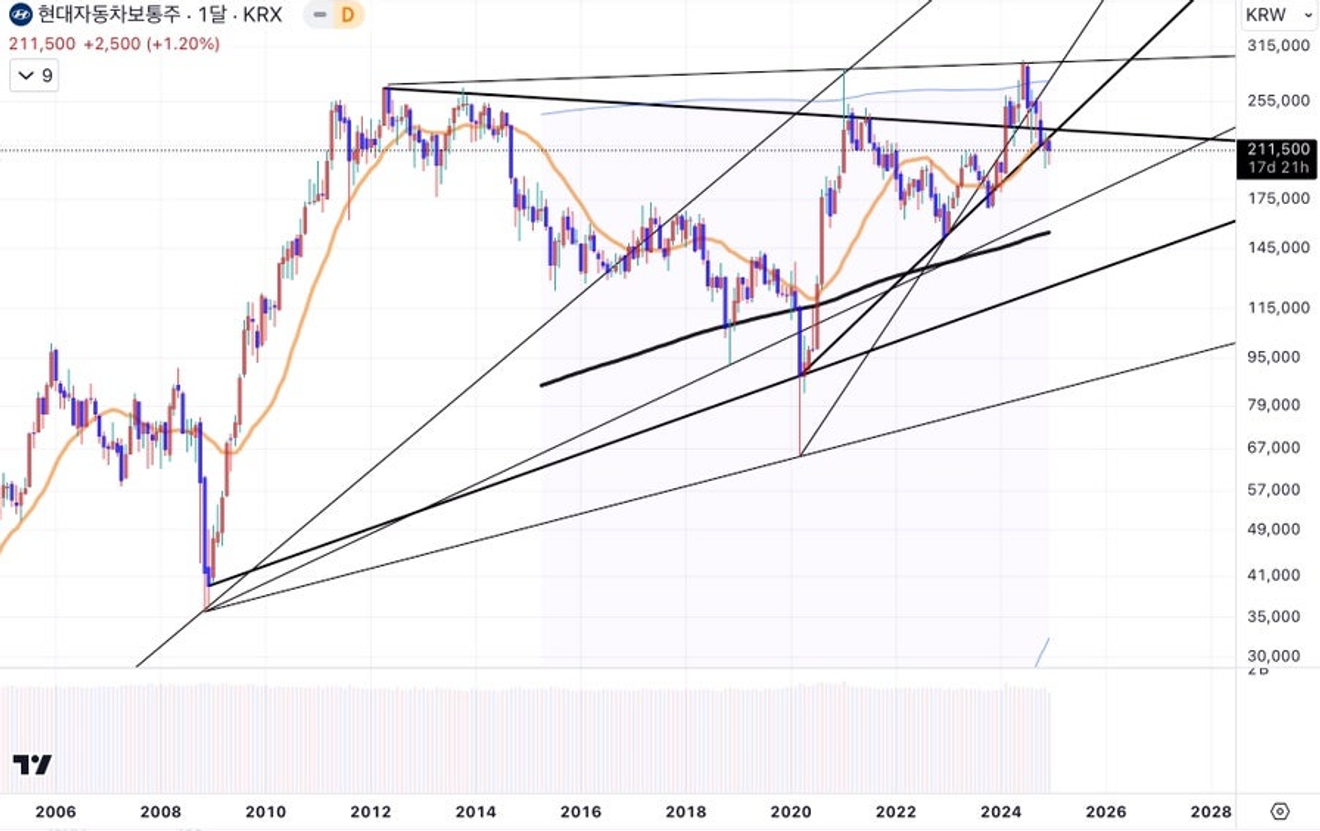
Hyundai Motor Monthly Chart
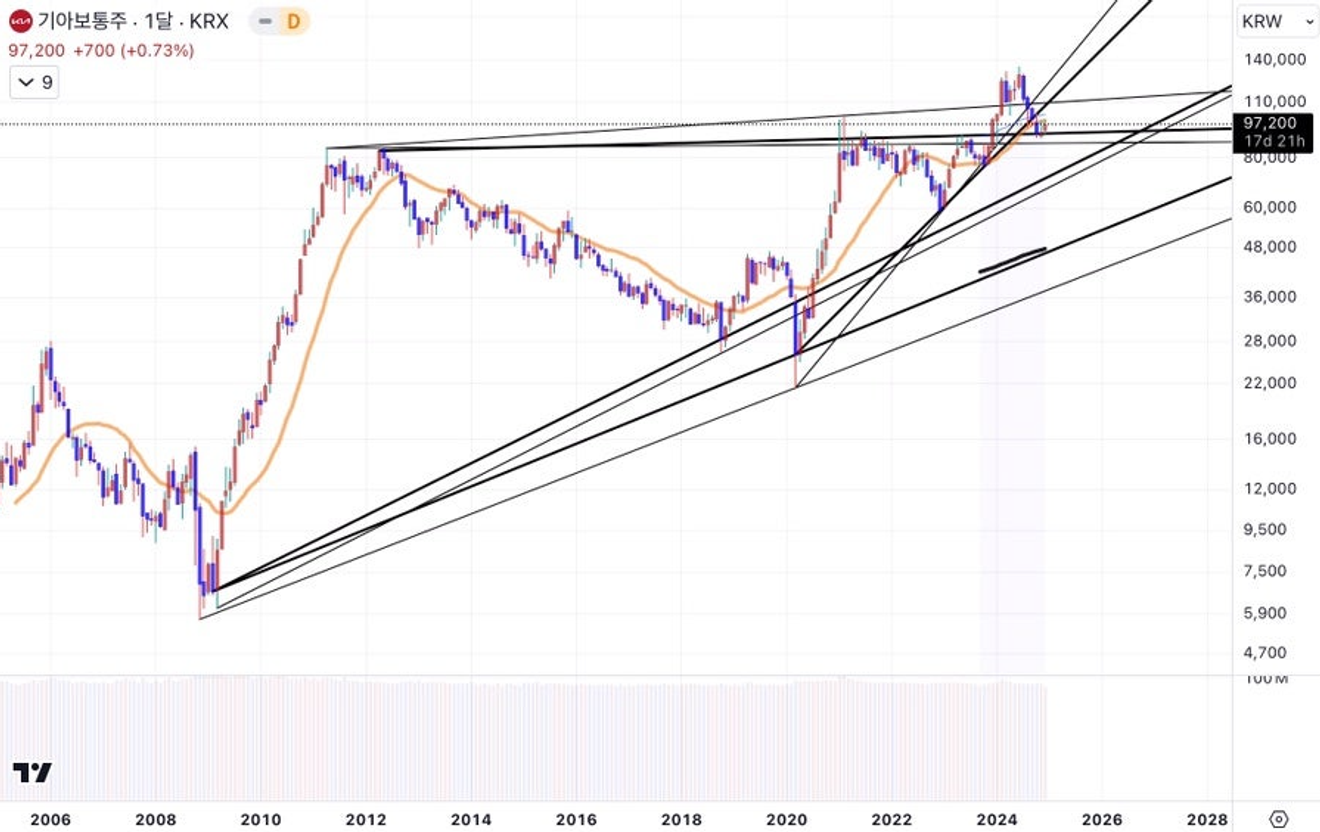
Kia Monthly Chart
If we had to choose only two companies from this list for a long-term perspective of several years, I would probably select SK Hynix and Kia.
This is not to say that their stock prices will absolutely rise in absolute terms in a few years, but rather that they appear "relatively" promising based on the charts.
In short, what's important for the domestic stock market now is that we need to consider both the domestic situation and the US (global) situation. It seems to be a time for investors with significant holdings to carefully consider their next steps.