- 미 시민단체, 바이든 '국경 빗장'에 제동…소송전 개시
- 미국 이민자 인권 단체들이 조 바이든 행정부의 불법입국자 망명 제한 조치를 막기 위한 소송전을 시작했다고 로이터통신이 12일(현지시간) 보도했다. 이에 따르면 미국 시민자유연맹(ACLU) 등 이민자 인권 단체들은 지

Until last year, the strength of US economic indicators, coupled with high inflation rates, was the biggest concern for economists. However, this year, while the US economy is still considered strong, some indicators show weakness, raising concerns about a recession. This seems to be a significant difference.
Among the various US economic indicators released periodically, some remain consistently strong, while others suggest an imminent recession, creating market volatility. Let's briefly consider this by looking at the trends of several key economic indicators.
Below is a chart showing the trend of real GDP, which represents the overall size of the US economy. While it's a key indicator, its quarterly nature means it's released later than monthly indicators, resulting in relatively less market impact than expected. The dotted line shows the year-on-year (YoY%, right vertical axis) growth rate trend.
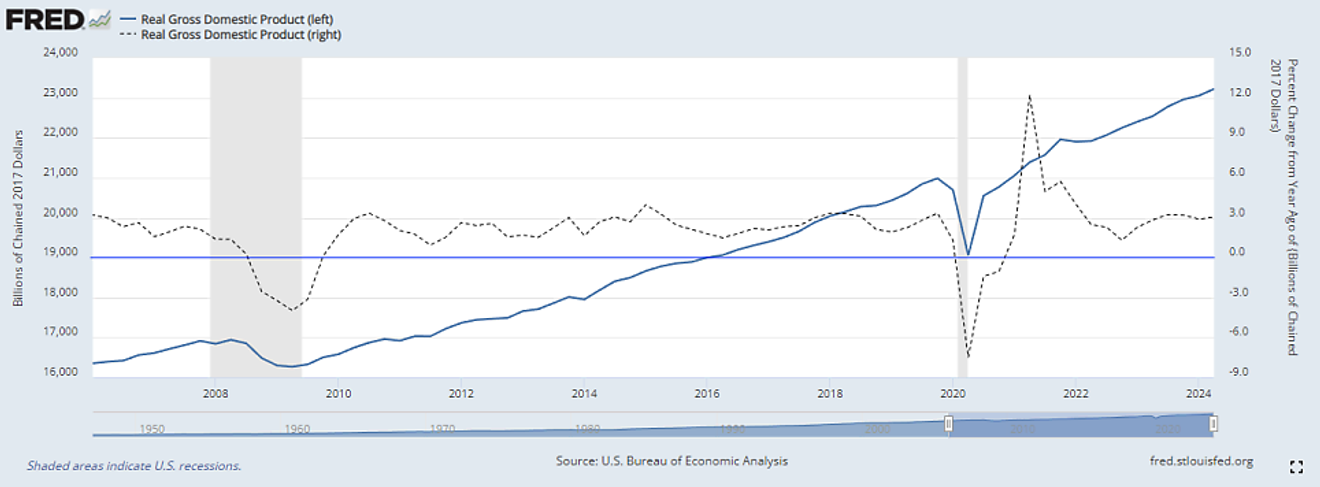
Real GDP Trend and YoY Trend
This real GDP trend shows a sharp decline during the COVID-19 pandemic, followed by a recovery due to large-scale stimulus measures by the federal government and the Federal Reserve. From the latter half of 2021, it returned to its pre-pandemic growth trend and has maintained that trajectory to the present.
The consistent adherence to the pre-pandemic growth trend strongly suggests that the Biden administration, perhaps intentionally, has made efforts to maintain this trend, even if it meant some degree of strain.
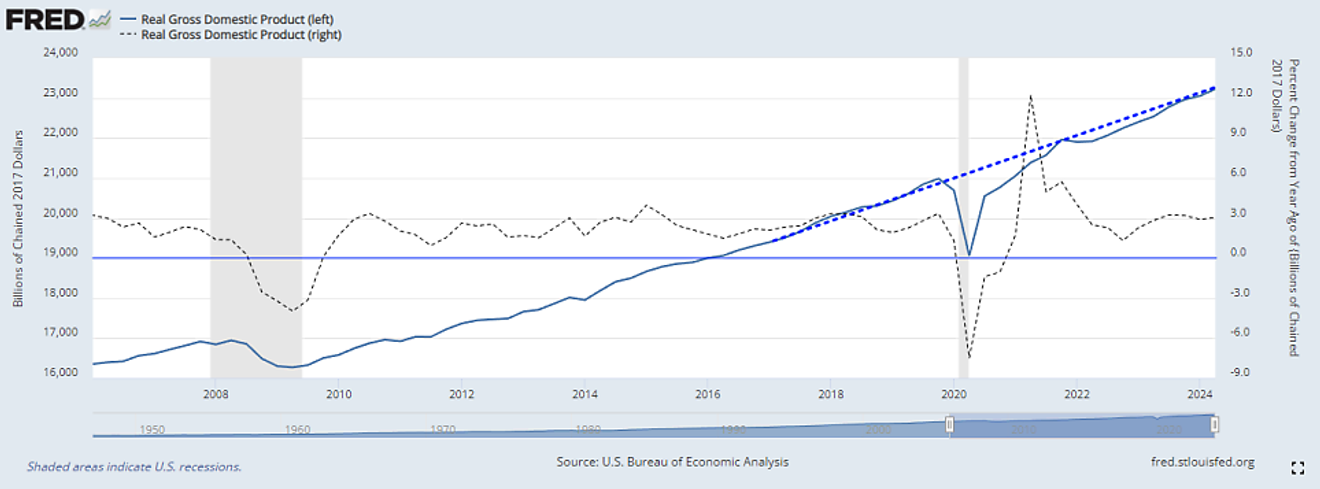
Real GDP
If the effort to maintain the previous real GDP growth trend involved some strain, there would likely have been sacrifices in other areas. Below is a chart showing the proportion of government (federal and state) spending relative to nominal GDP, and the percentage increase in government debt per quarter relative to GDP.
Looking at the proportion of government spending to overall GDP, excluding the period immediately following the COVID-19 pandemic’s large-scale stimulus, it has consistently remained around 35% since the mid-2010s.
The quarterly spending proportion shown below indicates that after a higher average level of government debt increase per quarter than before following the 2008 global financial crisis, this level continued even after the COVID-19 pandemic. It seems that this sustained government debt increase and the resulting spending level are major reasons why real GDP has consistently maintained its growth trend.
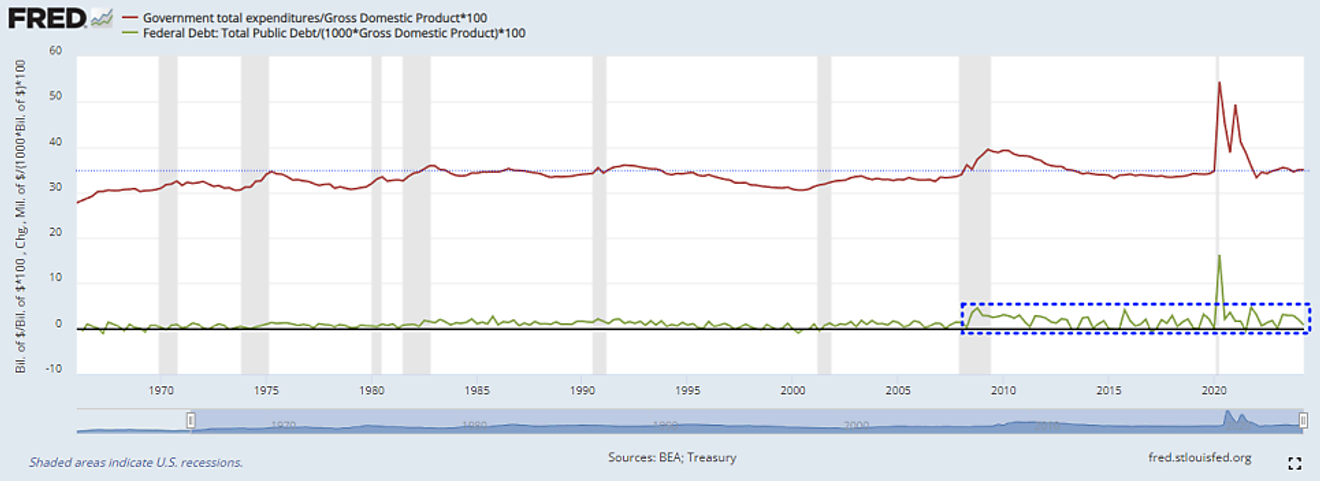
Proportion of Federal + State Government Spending to Nominal GDP, Proportion of Quarter-on-Quarter Increase in Government Debt to Nominal GDP
Meanwhile, below are charts showing the trends of real personal consumption expenditures (PCE) and retail sales, two major indicators of US consumption, adjusted for inflation.
Looking at recent YoY trends, PCE is converging to the pre-pandemic growth rate, showing a steady trend. In contrast, retail sales, while at a historically high level, show signs of slowing growth, with a slight stagnation.
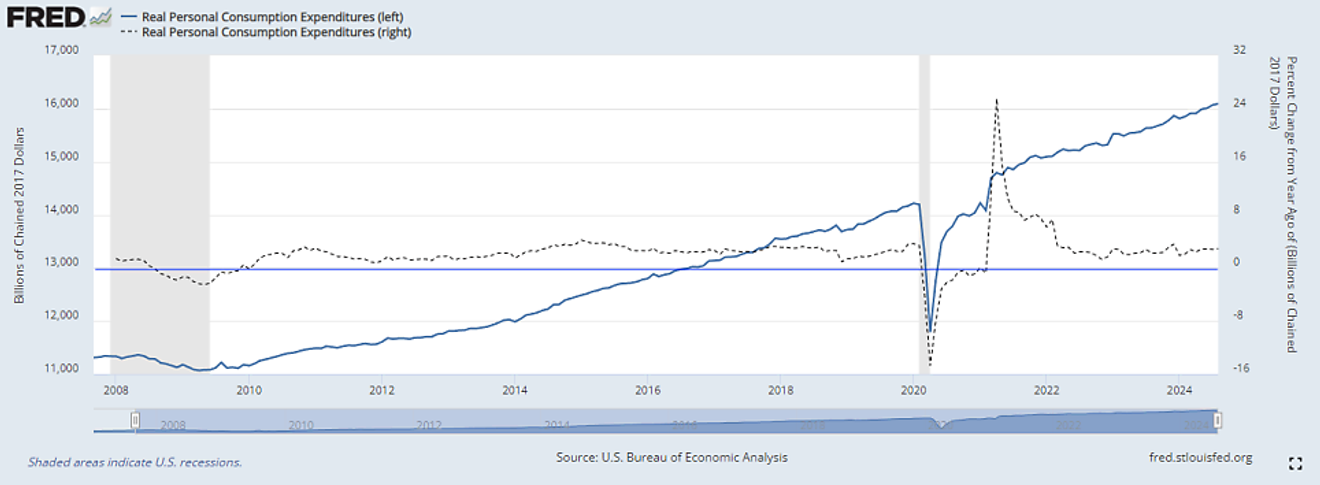
Real Personal Consumption Expenditures (PCE) Trend and YoY Trend
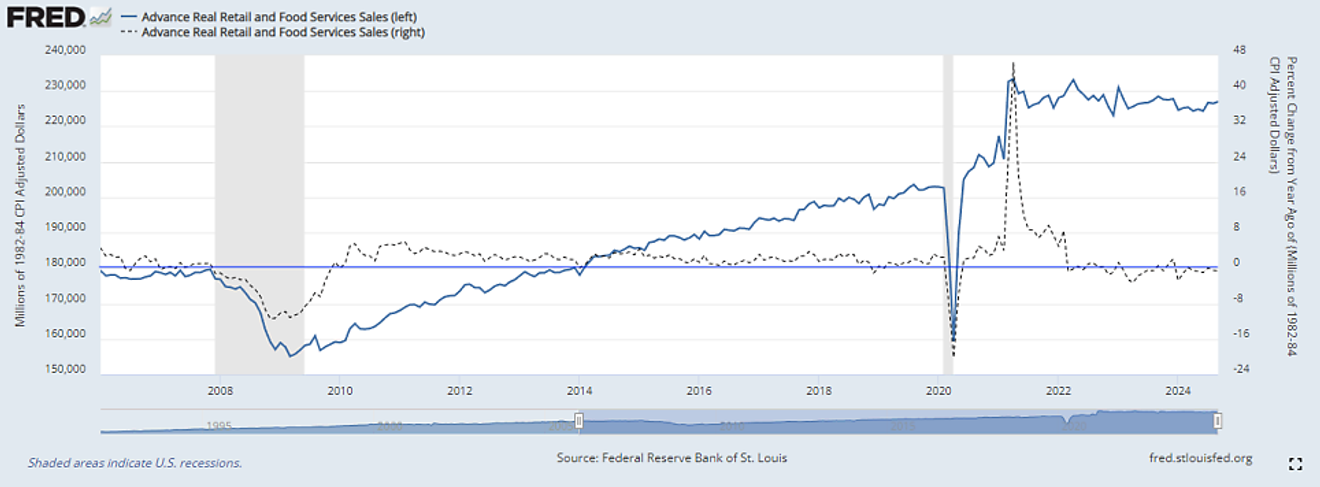
Real Retail Sales Trend
However, viewing these charts in the context of the pre-pandemic growth trend extension reveals a slightly different perspective.
The charts below show that if we extend the pre-pandemic growth trends of personal consumption expenditures and retail sales, the projected levels at the current time are similar. However, retail sales unusually spiked significantly around 2021 due to pent-up demand, exceeding personal consumption expenditures. This may have led to a prolonged period of stagnation afterwards.
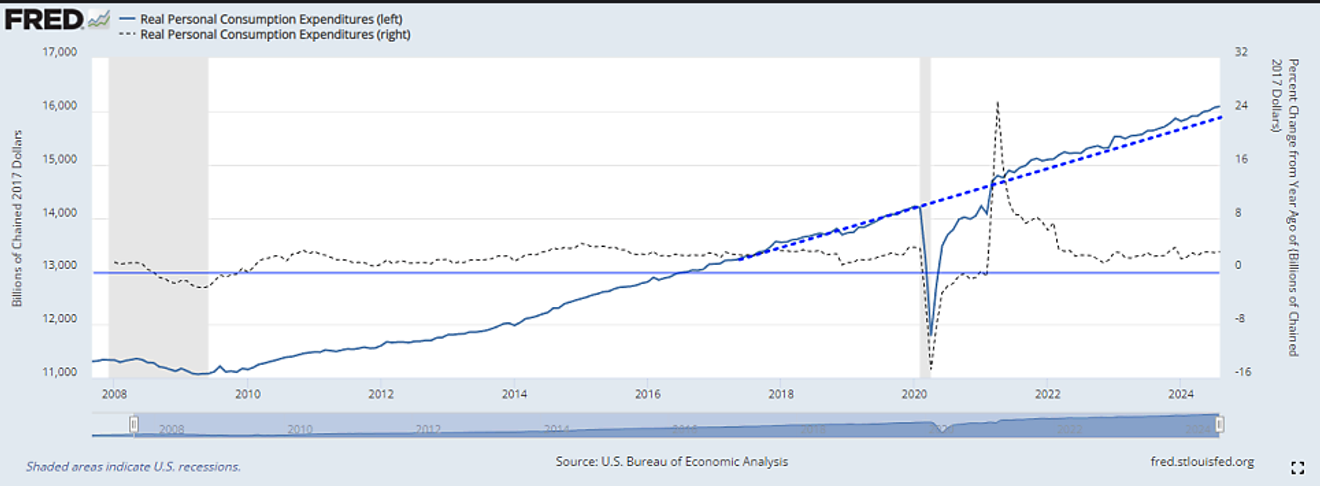
Real Personal Consumption Expenditures (PCE) Trend
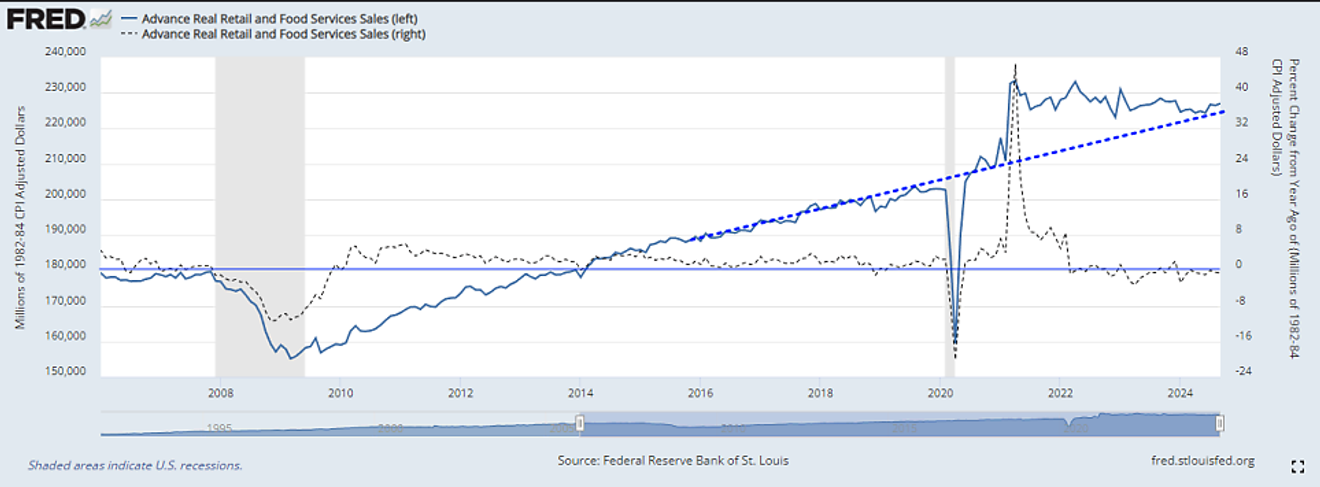
Real Retail Sales Trend
Next, we look at employment indicators.
The chart below shows the trend of nonfarm employment based on establishment surveys (payroll surveys). Following a strong post-pandemic recovery, it has almost caught up to the pre-pandemic growth rate, and now approaches the annual rate of the pre-pandemic level. Considering the persistence of high interest rates, it still shows a strong trend.
Reasons cited for this indicator's continued strength include the effects of illegal immigration and the double-counting of individuals holding multiple jobs, potentially leading to an overestimation. This needs to be considered.
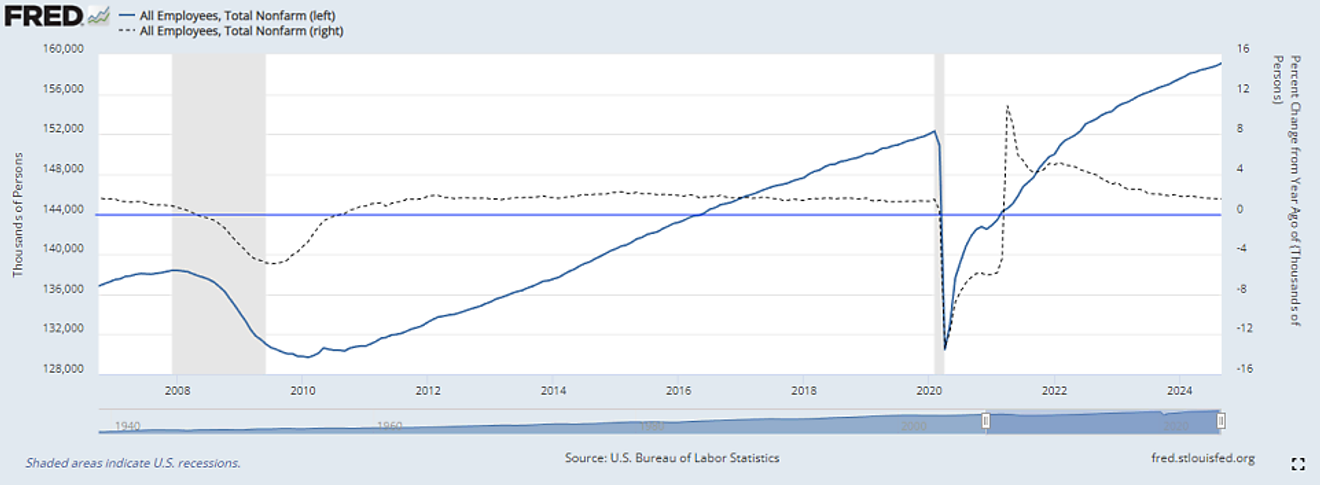
Nonfarm Employment (Establishment Survey, total nonfarm)
Below is another indicator reflecting the US employment situation, derived from household surveys. Due to its methodology, payroll surveys are considered more reliable, making this data less frequently cited and not used as a headline employment indicator.
While the impact of illegal immigration isn't always significant, the continuous influx and the prevalence of individuals holding multiple jobs generally result in a lower year-on-year growth rate compared to payroll establishment surveys. As shown below, this has been largely stagnating for the past year.
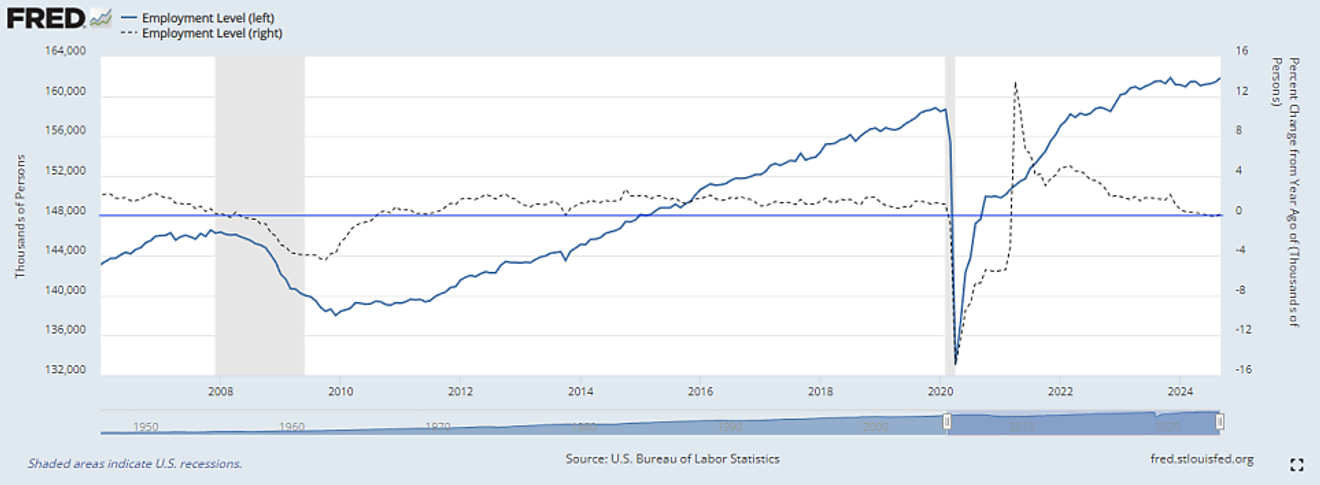
Nonfarm Employment (Household Survey, employment level)
Similarly, the unemployment rate from the same survey is no longer decreasing and shows a slight upward trend from its bottom. This ‘Okun’s Law’ issue caused some market sensitivity around July-August.
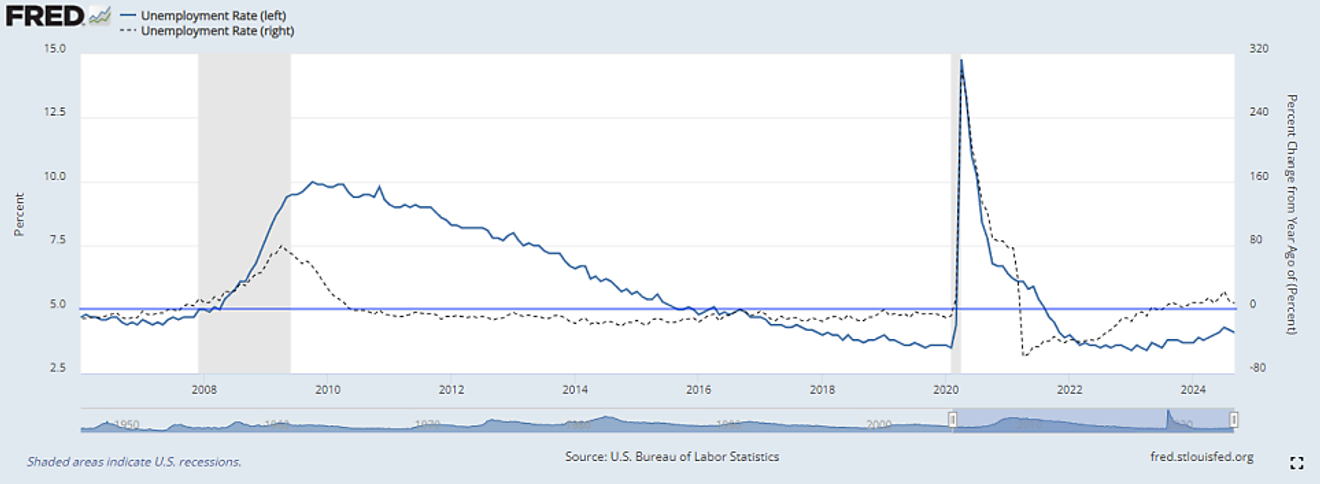
Nonfarm Employment - Unemployment Rate (Household Survey)
Below is a graph showing the proportion of employed individuals in the US holding multiple jobs.
While there's a high probability of further increase, this ratio, which sharply decreased after the COVID-19 pandemic, has now returned to its pre-pandemic level. At least, the illusionary increase in total nonfarm employment due to multiple job holders has returned to its pre-pandemic state, suggesting that most of its potential contribution has been exhausted. Even assuming there is some additional capacity.
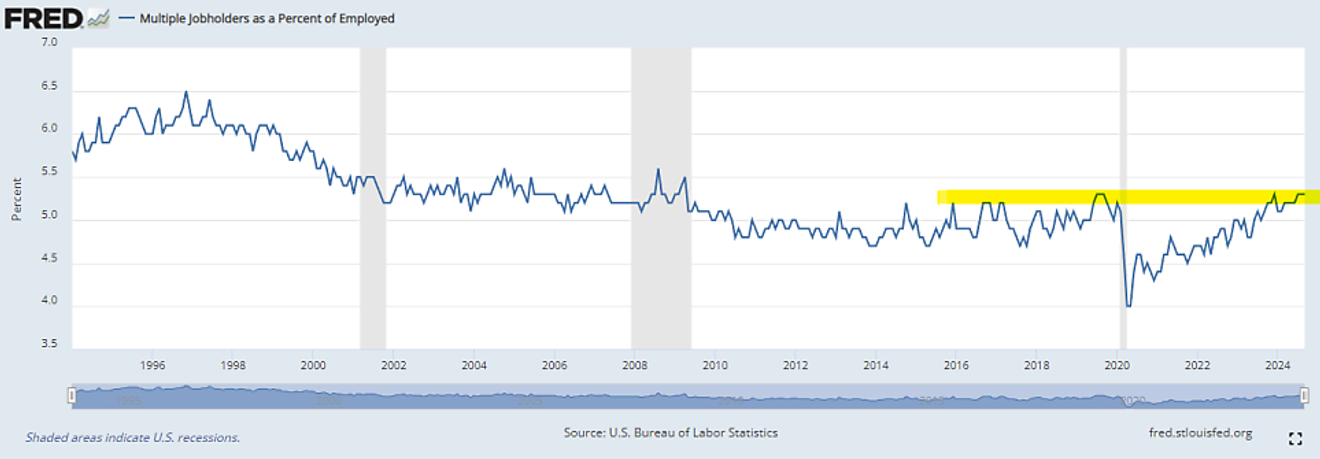
Proportion of Multiple Job Holders among Employed Persons
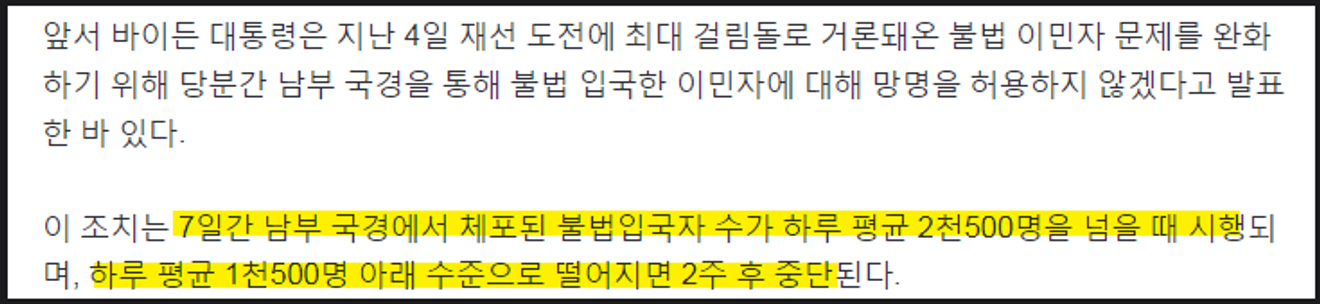
The effect of illegal immigration on the surge in nonfarm employment has weakened since the Biden administration's June executive order on border control, before the midterm elections, although some level of control remains possible.
The article below on the Biden administration’s June measures on illegal immigration shows that it wasn’t a complete ban on illegal entry at the border, but rather a ‘rate control’ measure.
Illegal immigration control was implemented to manage the rate of illegal entries to around 1,000 to 2,500 per day. This is not a complete ban. (Even 1,000 per day adds up to 30,000 per month.)
Rather than a sudden disappearance of the immigrant effect, this executive order seems intended to maintain the effect of around 200,000 new jobs per month until the next administration.

(To be continued in Part 2 due to upload size limitations)
Comments0