Subject
- #KOSDAQ
- #Samsung Electronics
- #KOSPI
- #Long-term Trend
- #Stock Index
Created: 2024-10-11
Created: 2024-10-11 03:01

For most ant investors, including myself, a few months is a rather long-term period. Therefore, we usually look at daily charts, not monthly charts with long time series.
Recently, the stock price of Samsung Electronics, the leading stock in the domestic stock market and the undisputed market cap leader, has been consistently poor. Listening to YouTube, you often hear comments like, "The KOSPI and KOSDAQ trends are fine, but why is only Samsung Electronics' stock price like this?"
Is that really the case? Is Samsung Electronics the only company with a poor stock price trend?
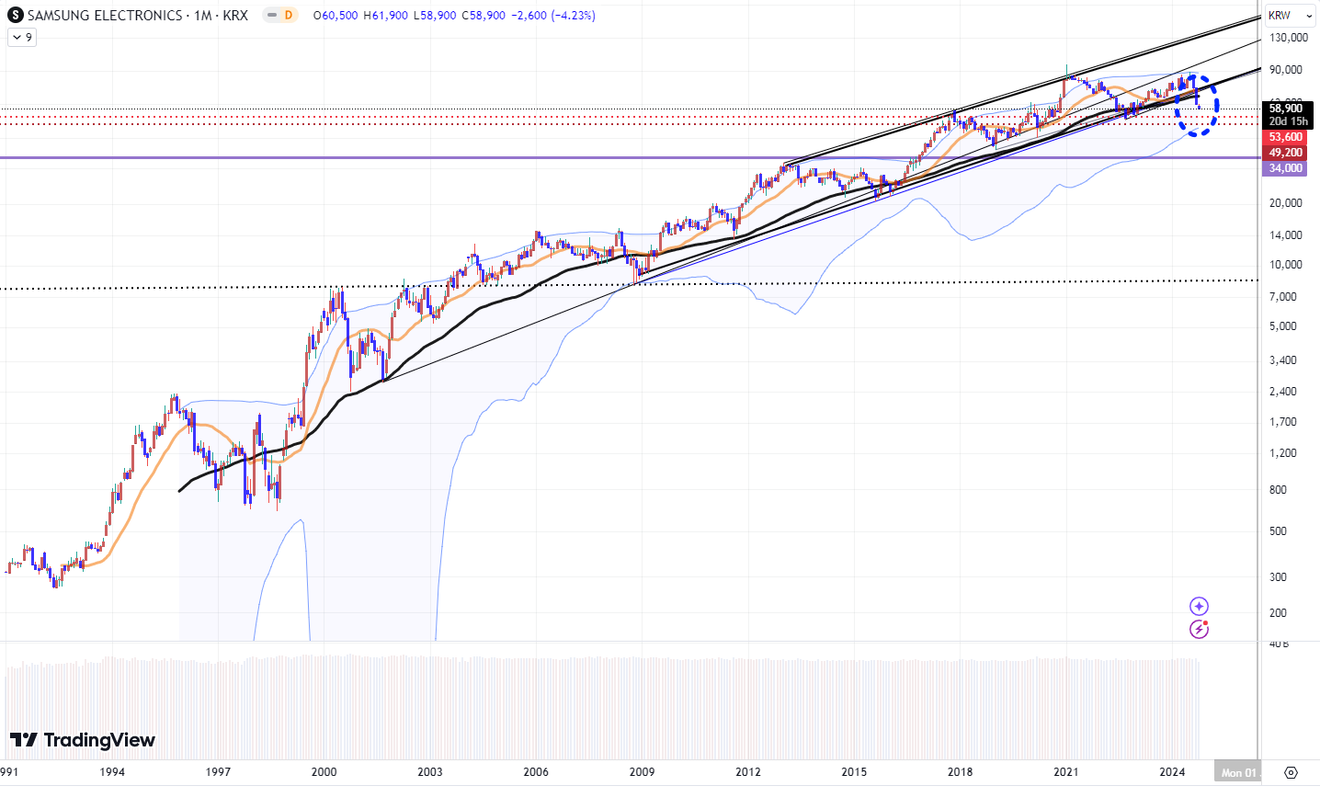
The chart below shows the long-term chart trend of Samsung Electronics' stock price from the 1990s to the present, viewed monthly. Like most domestic conglomerates, Samsung Electronics faced a crisis during the 1997 IMF foreign exchange crisis. However, since then, Samsung Electronics has been riding a steady, long-term upward cycle since the 2000s.
Then, in the latter half of 2022, the long-standing trend seemed to break, but it persisted and rebounded until recently. Lately, however, there is a trend to pull away from the long-term trend.
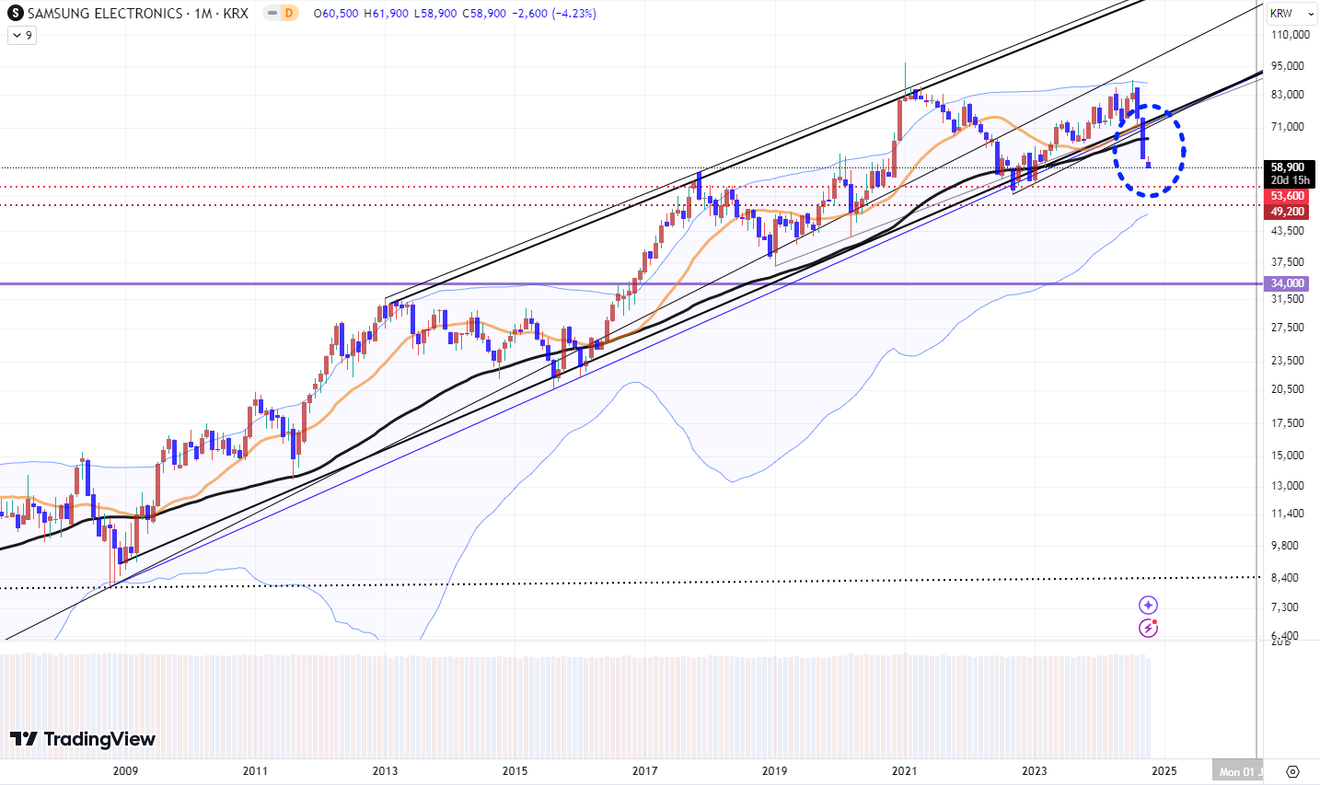
Looking at the zoomed-in chart below, the current stock price trend is clearer. The fact that the long-term trend has broken doesn't necessarily mean a long downward plunge.
However, with its status in the semiconductor industry gradually declining, there are talks that Samsung Electronics alone is entering a winter. This long-term stock price chart trend seems to indicate that cracks are appearing in the competitiveness that Samsung Electronics' semiconductor business division once possessed.
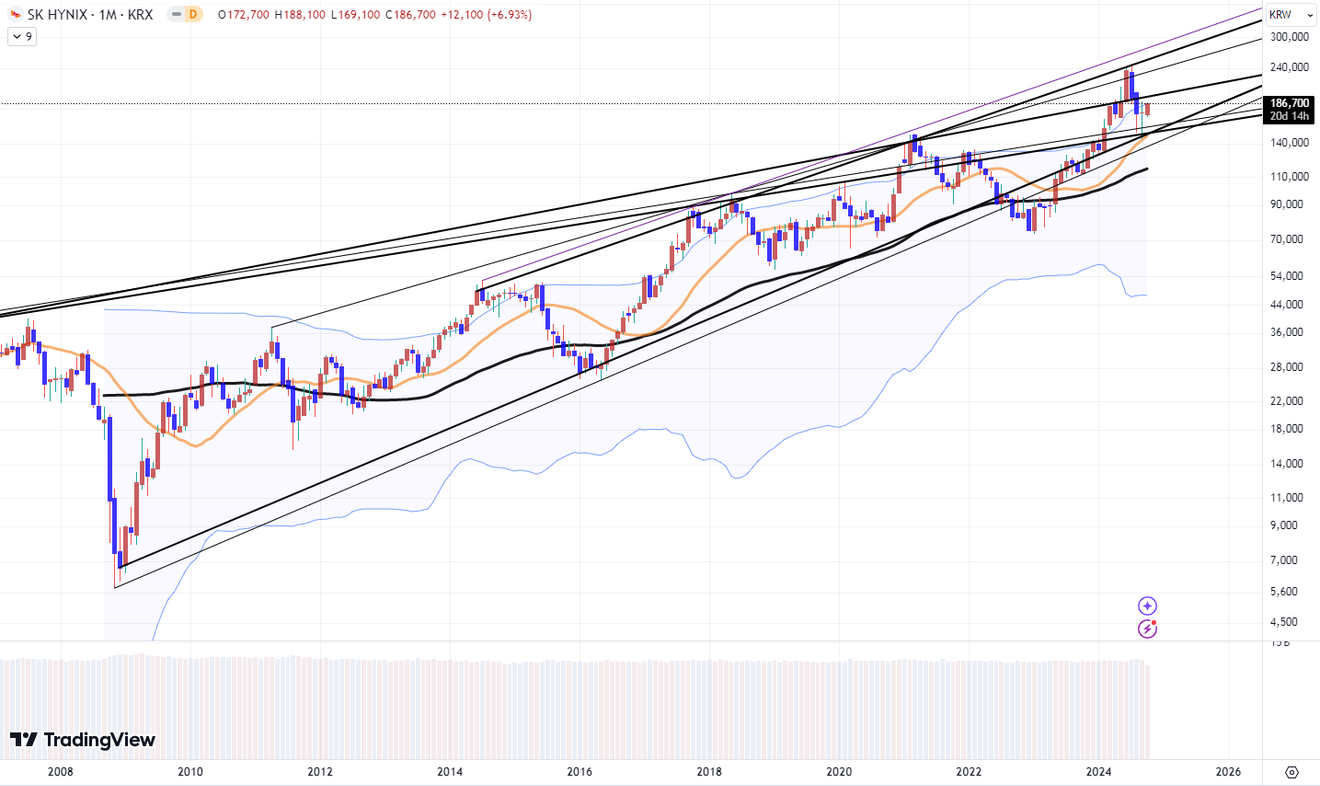
Even a look at the monthly chart trend of SK Hynix below, compared to the same period as the chart above, gives a distinctly different feeling from Samsung Electronics. Whether it's solely a matter of HBM remains to be seen...
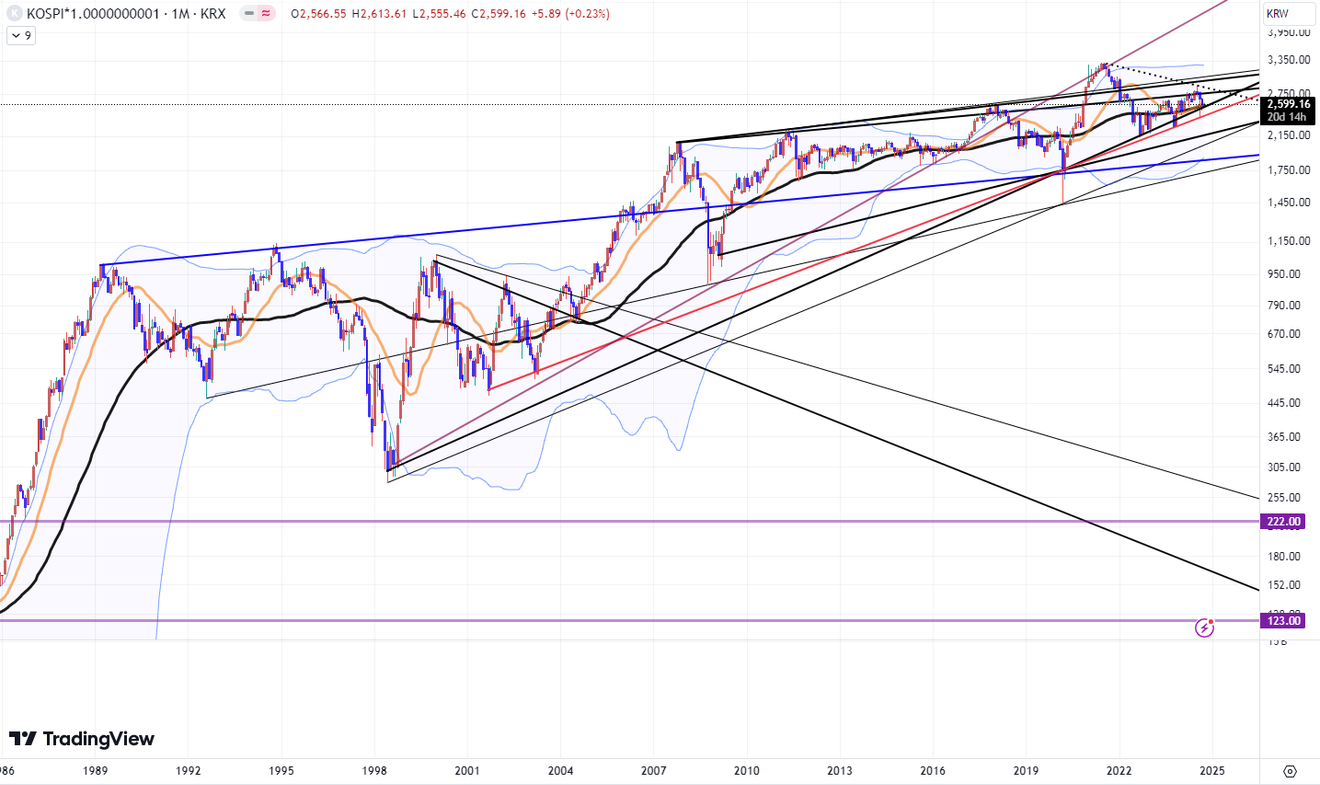
While Samsung Electronics has a significant impact on the domestic composite stock price index, given Samsung Electronics' trend, we wonder if it's only a Samsung Electronics problem, so let's also look at the long-term trend of the two major indices, the KOSPI and KOSDAQ.
Below is a monthly chart showing the KOSPI index trend from the mid-1980s to the present. However, the KOSPI index does not yet feel like the major trend is breaking, unlike Samsung Electronics. Even if it falls further from its current position, there are still several supports to cushion the fall. The current index position doesn't seem to signal an immediate long-term decline.
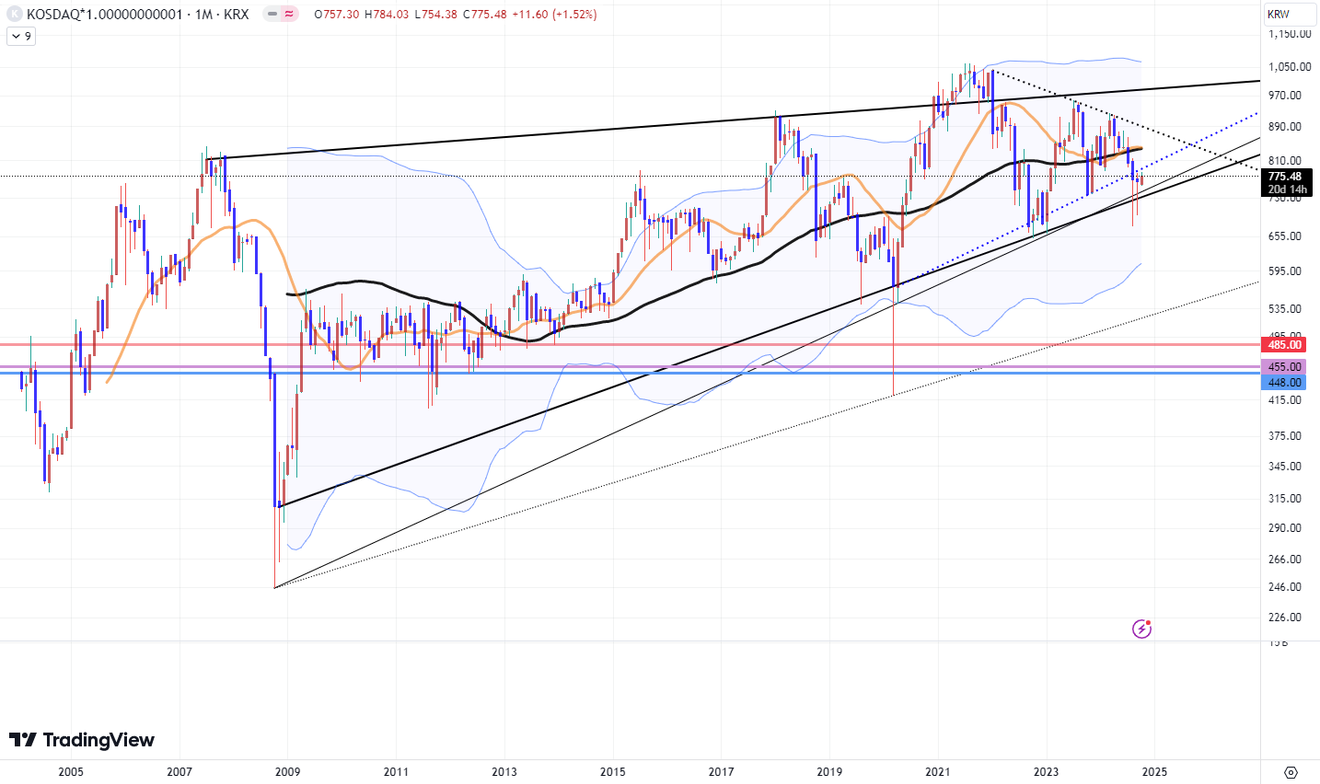
Next is a monthly chart of the KOSDAQ index from the early 2000s to the present. This may be due to its relatively short history compared to the KOSPI index. However, compared to the long-term chart of the KOSPI index above, if the current position weakens, the area below seems relatively weak. It feels like it lacks fundamental strength.
Although there is a support line below, it doesn't look very reliable. However, there is a support that can hold relatively well at the current position. The chart has shown a pattern of three consecutive months with lower wicks, suggesting an attempt to hold the line.
Therefore, if the monthly chart fails to find support at this point and weakens, it is likely to fall to one of the lines indicated below. I briefly mentioned in a previous post that this is the path it's currently taking.
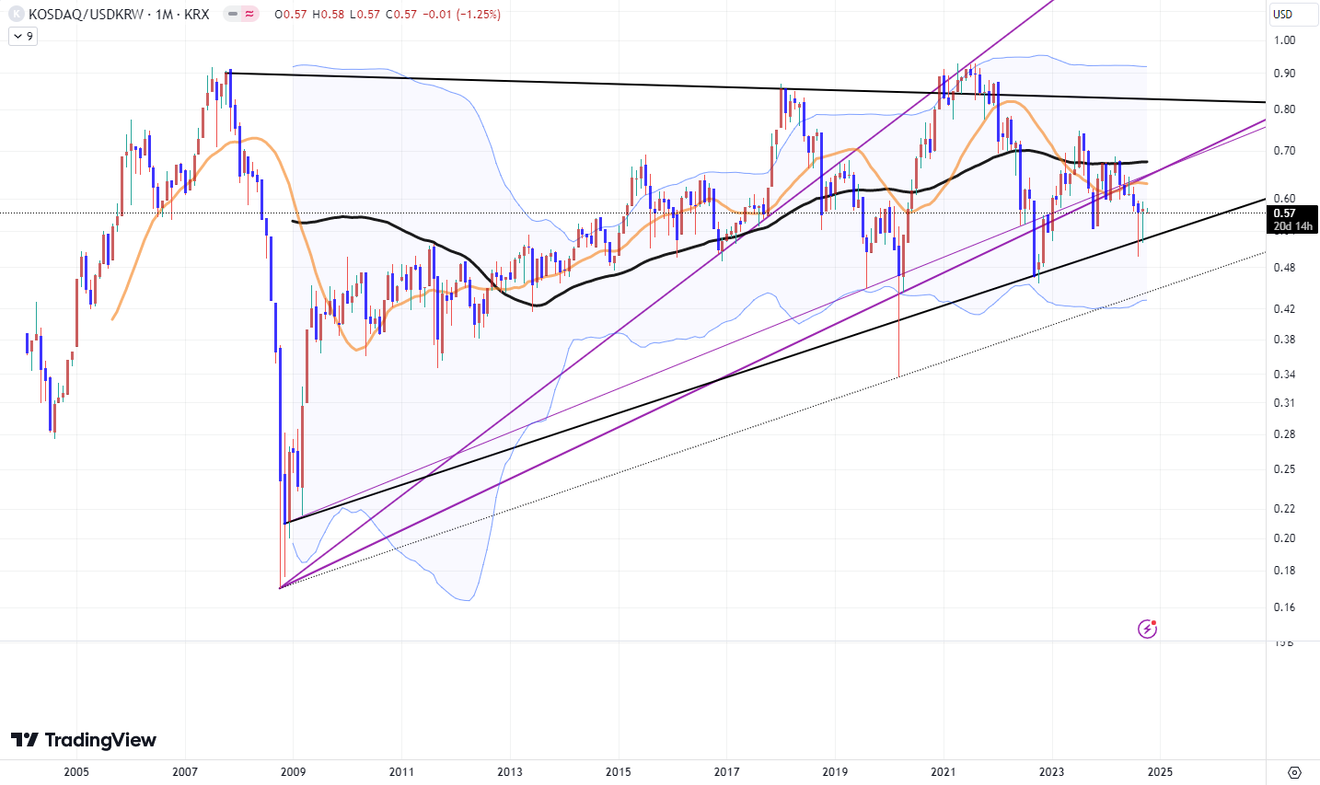
Let's look at the same KOSDAQ index again, this time considering foreign investors. The chart below shows the KOSDAQ index recalculated by dividing it by the won-dollar exchange rate.
It's not significantly different from the original KOSDAQ index. However, as the value of the won has gradually fallen against the dollar over a long period—contrary to predictions that the dollar would become worthless—the chart below looks slightly more suppressed than the one above.
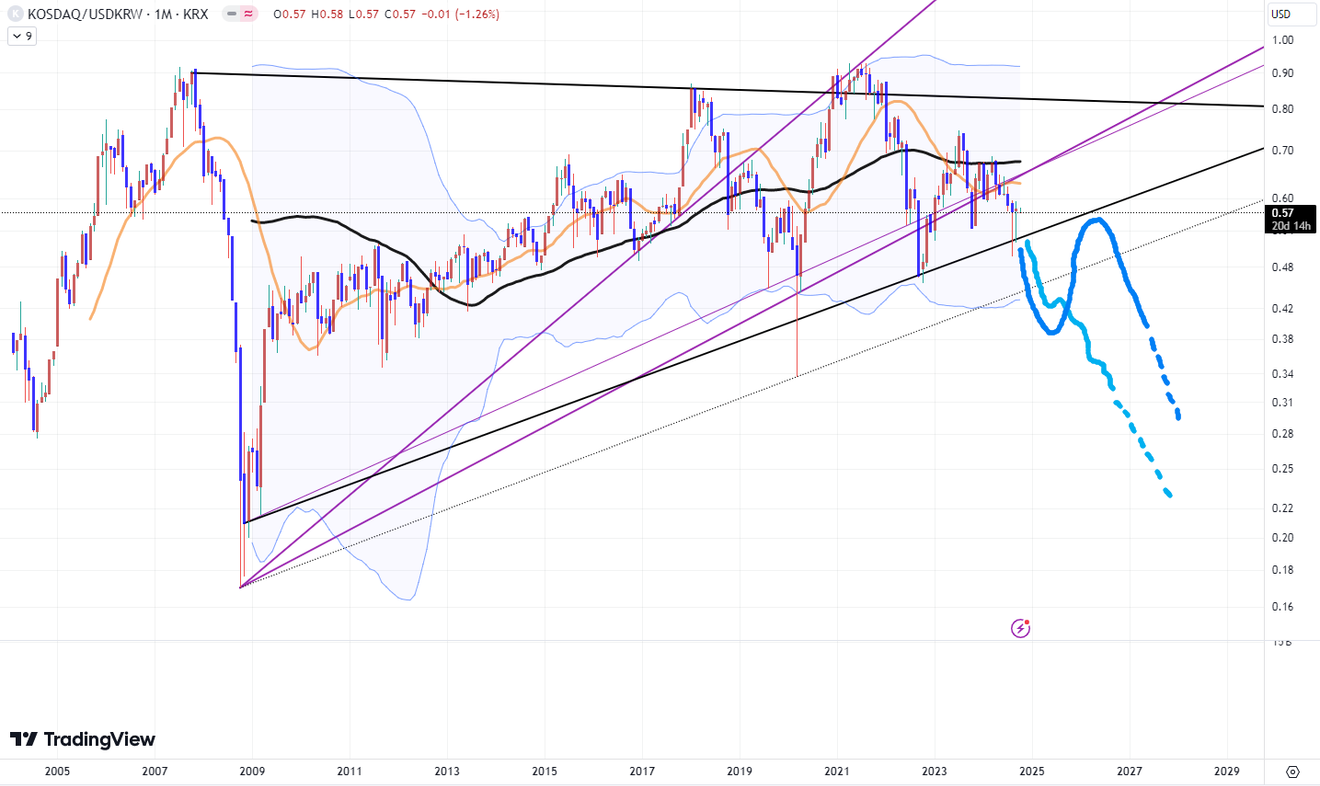
If this support, which has been showing lower wicks for three months, breaks through for the KOSDAQ index as viewed by foreign investors in dollar terms, wouldn't they think that the trend since the financial crisis has been broken?
If it breaks through, depending on how long the US economy and stock market can withstand a recession, the market might plunge immediately or, if the US economy holds longer, rebound significantly before finally weakening later. It's a matter of how much time elapses until the US economy and stock market enter and remain in a recessionary state.
There are opinions that the US economy remains strong, focusing on the recent strong September US employment figures. Conversely, there are opinions that it's a temporary surge in indicators due to a slowdown.
Depending on how long the US economy, particularly its employment sector, maintains its robust trend, the path of the domestic stock market will likely change. Even if the KOSDAQ and KOSPI charts differ, they cannot have completely different trends.
In the short term, the trend will depend on whether the still-strong US stock market continues its robust performance and pulls up the recently fallen domestic stock markets, or vice versa—whether the US stock market will follow the domestic market's decline later, mirroring what happened in 2021. We need to determine which scenario is more likely.
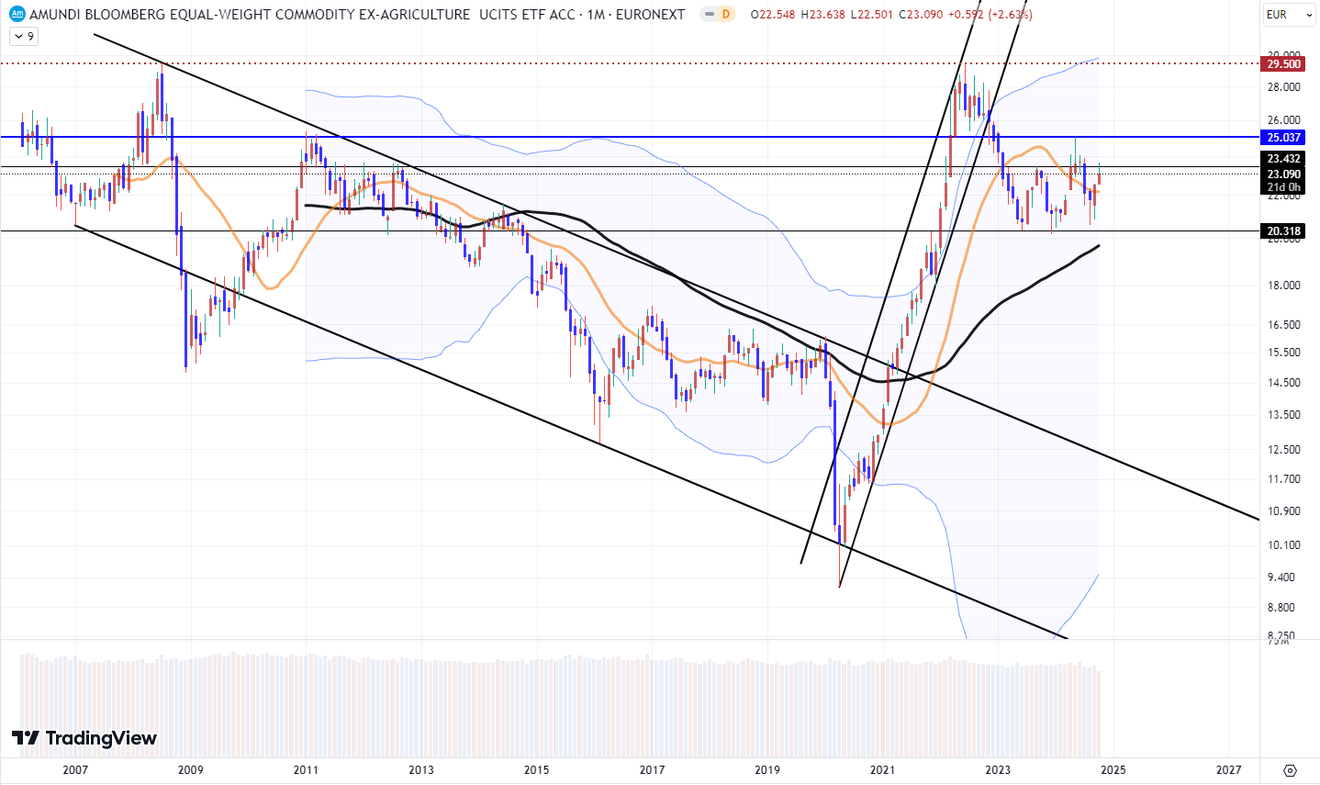
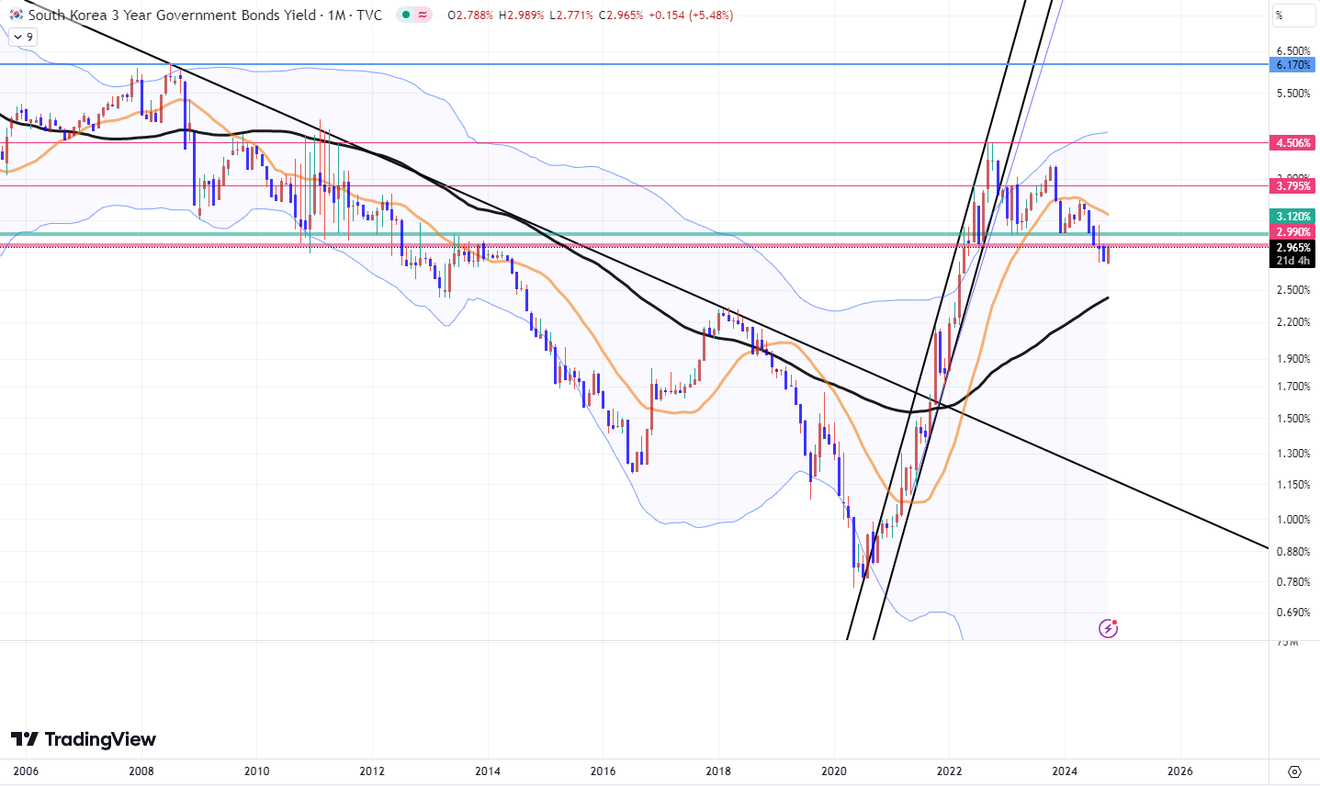
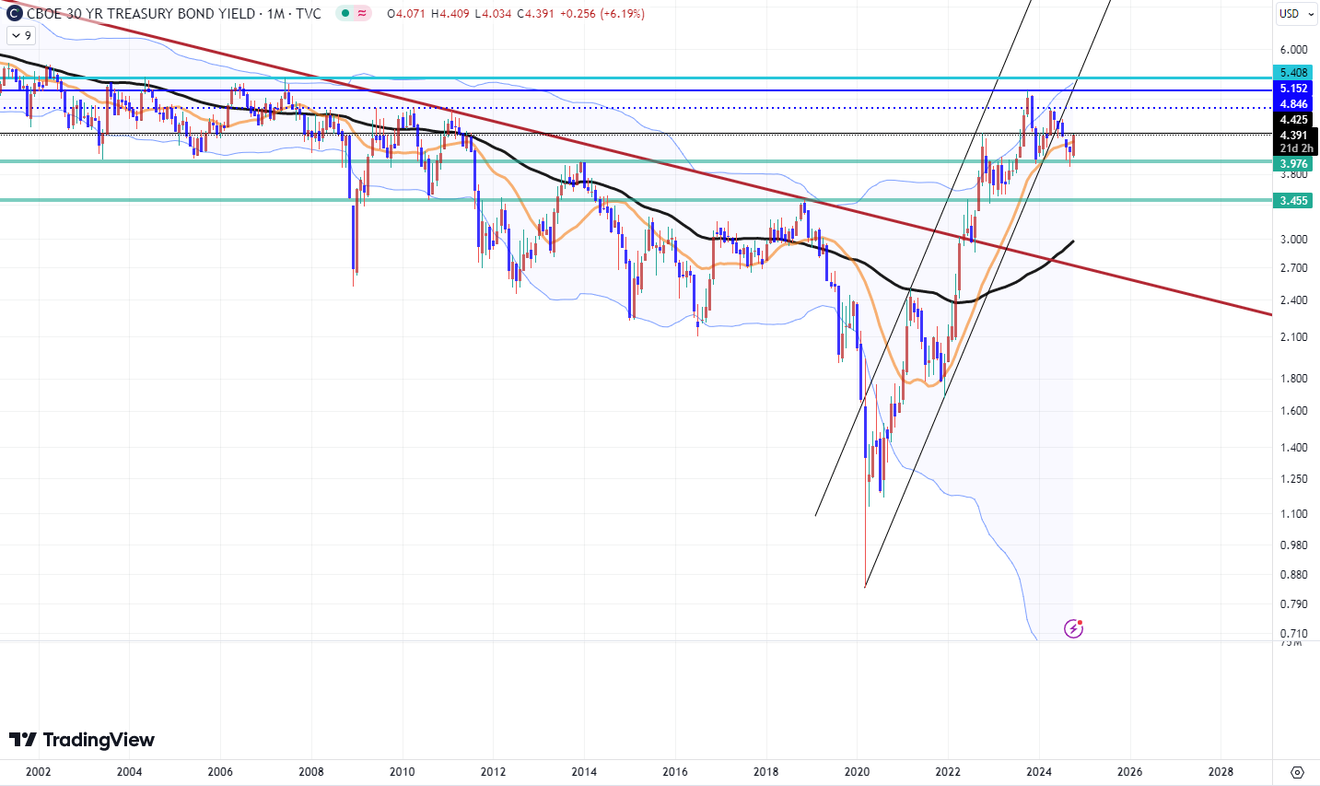
Meanwhile, below is the monthly chart trend of the commodity price index excluding agricultural products. The chart below that is the interest rate chart for the 3-year Treasury bond, the main domestic bond.
While the exchange rate effect should be considered, even from this alone, you'll sense a high correlation. And while US intermediate-term bonds show a different trend, we can see a similar linked trend in the long-term bonds (10 years and above) as shown in the bottom chart.
So, if Israel significantly attacks Iran, escalating the Middle Eastern conflict, what kind of trend will emerge? And how will this affect the domestic apartment and real estate market, which is currently showing concerns about a renewed entry into a trade cliff?
No matter how much Netanyahu pretends to fight with Biden, Israel is ultimately America's closest friend. Judging from the current situation, it feels strongly that we are heading towards a stagflationary recession that starts a Great Depression cycle. Even if it shifts to a deflationary type in the latter half, it will start as a stagflationary recession.
February 24, 2025
November 17, 2024
May 20, 2024
August 20, 2024
April 15, 2024
May 5, 2024
Comments0