Subject
- #US Stock Market
- #Long-Term Investment
- #Technology Stocks
- #Stock Market Outlook
- #Nasdaq
Created: 2024-11-05
Created: 2024-11-05 00:02

Since the 2008 global financial crisis, the US stock market has been led by Nasdaq technology stocks.
This trend has become particularly pronounced since the mid-2010s, with a small number of large-cap stocks in the Nasdaq, now known as "Big Tech" (or FAANG, Magnificent 7), dominating the market.
This is why the Nasdaq index, among the three major US indices, has been leading the market for over a decade.
Even within this skewed market, dominated by the Nasdaq, there seems to be a certain pattern. Below is a monthly chart showing the ratio of the Nasdaq 100 index (NDX) to the Dow Jones Industrial Average (DJI). Since the division results in decimals, we've multiplied by 100.
Looking closely at this chart, which represents the relative ratio between the two indices, we see that at the end of 2021, it reached the same level as the peak during the dot-com bubble. Immediately afterward, the Federal Reserve's rapid interest rate hike cycle led to a significant market correction lasting about 10 months.
Then, in the middle of this year, this ratio briefly surpassed the dot-com bubble peak before settling near it, with only minor fluctuations.
The chart below, spanning from the 1980s, shows that the US stock market has experienced long periods of growth when the Nasdaq, heavily influenced by tech stocks, led the market. If the tech sector falters, it could pose problems for the sustained growth since the financial crisis.
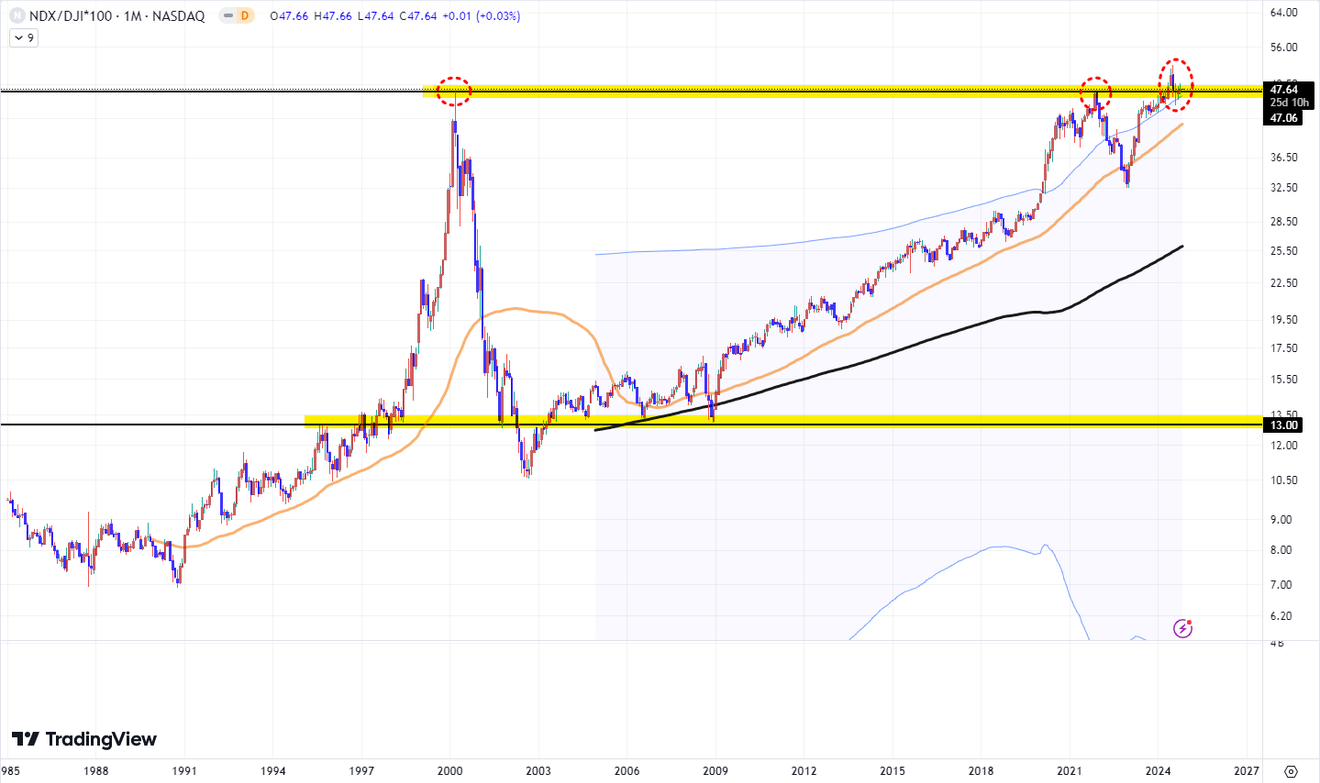
NDX/DJI*100
My prediction is that while this ratio has briefly exceeded the dot-com bubble peak for a few months, it will ultimately fail to sustain itself and fall back down.
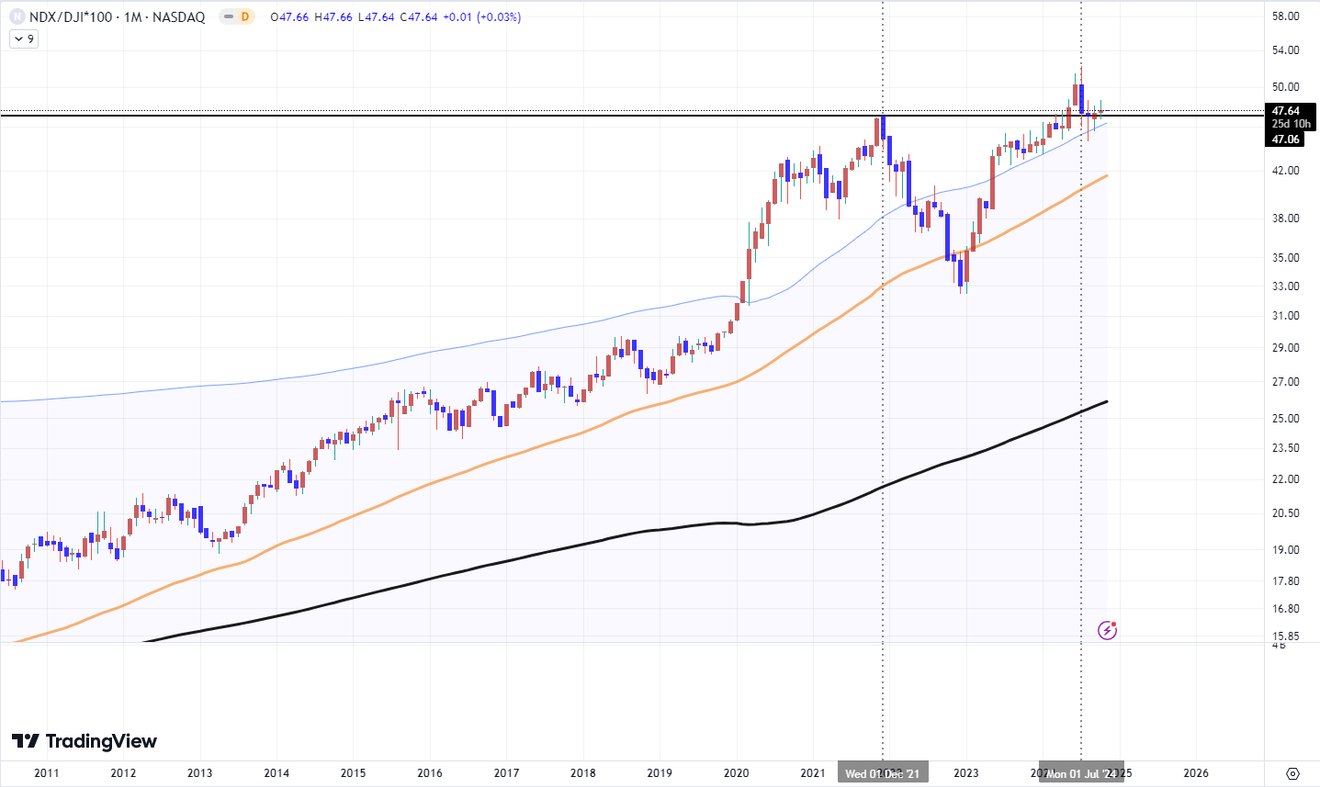
Since the end of 2021, I believe the US stock market has entered a broader second Great Depression cycle. We've seen a prolonged period of high-price consolidation (range-bound trading in high-price areas), and I expect this to continue for some time.
From this perspective, the 10-month correction of 2022 is simply an extension of this range-bound movement.
A closer look at the recent period of the chart above shows that the ratio between the two indices peaked in December 2021 and again in July of this year, following market adjustments.
In July, the market's adoption of the "AI skepticism" narrative, following a period of short-term overheating, prevented further gains in semiconductor stocks and the Nasdaq index. Will a resurgence of tech-stock-led growth push this NDX/DJI ratio upward again?
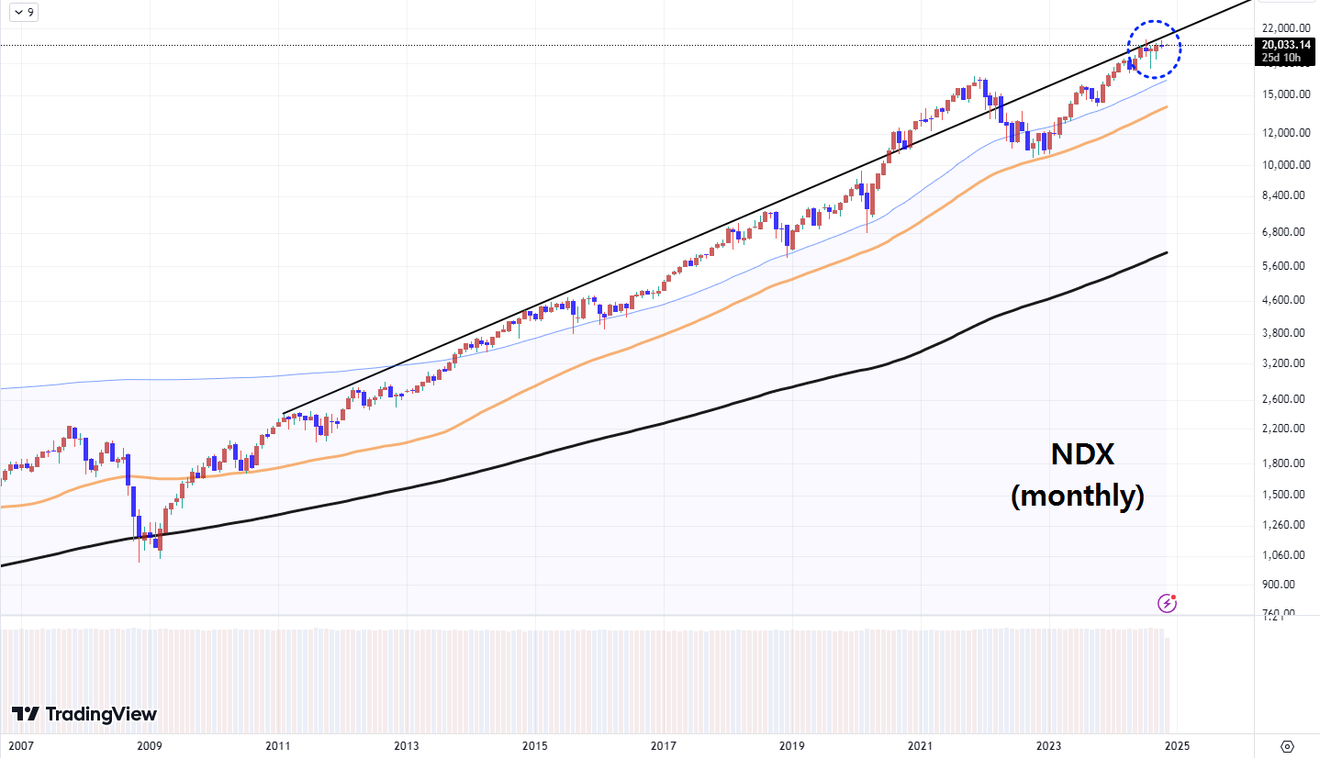
Let's consider this by looking at the current positions in the following monthly charts.
This chart is a monthly chart of the Nasdaq 100 index (NDX).
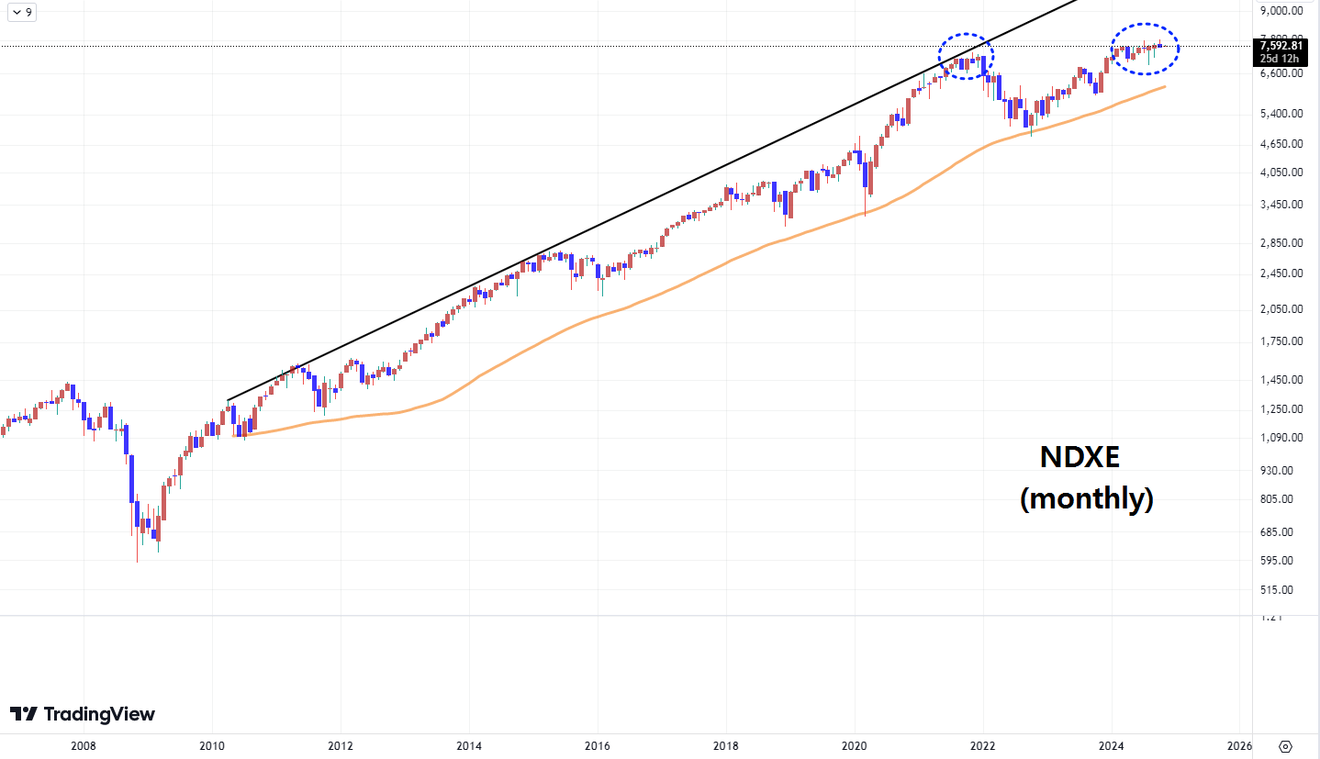
The chart below shows NDXE, an index that tracks the equal-weighted average of Nasdaq 100 stocks. The original index, NDX, is market-cap weighted, heavily influenced by Big Tech, while NDXE represents the average price trend of all Nasdaq 100 stocks.
Both indices are facing resistance at their positions from the end of 2021 and now. At the end of 2021, this was followed by a significant market correction. Currently, resistance is being met and we are awaiting further movements.
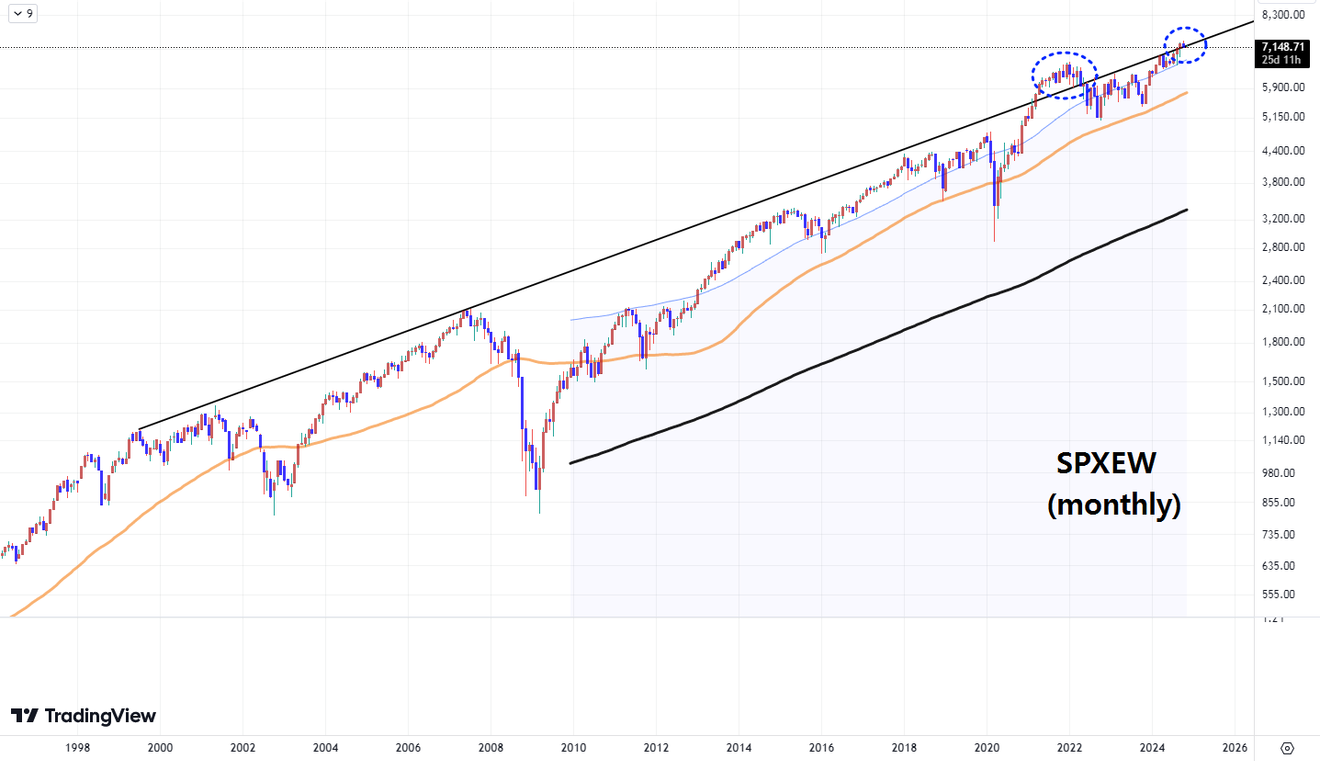
For reference, here's a similar chart. The chart below is a monthly chart of SPXEW, an index that tracks the equal-weighted average of S&P 500 stocks.
Similar patterns to those observed in NDX and NDXE are visible at the end of 2021 and currently.
Can we predict what will happen next from the current position?
At least, it can be surmised that the current resistance levels on the monthly charts are technically very significant.
If further upside is halted at the current index levels, and signs of a shift in direction appear in the daily charts over the past few months, then the possibility increases.
However, looking at the short-term daily trends, I believe there are strong indications of such a shift in the stock indices and other market indicators.
From a technical perspective, if the current position on the Nasdaq monthly chart is capped, it may not signal the beginning of a long-term collapse in the US stock market, but it could be a ceiling where the long-term high is capped first, so caution is needed regarding excessive equity holdings.
While there is much speculation surrounding the surge in cash holdings of Berkshire Hathaway, led by Warren Buffett, over the past few quarters, from my perspective, if Berkshire shares a similar view, then the continued stock sales and increase in cash holdings since 2022 are quite natural.
November 17, 2024
November 23, 2024
June 26, 2024
February 24, 2025
February 26, 2024
March 21, 2024
Comments0