Subject
- #US Stocks
- #Tech Stocks
- #Big Tech
- #M7
- #Stock Performance
Created: 2024-11-01
Updated: 2024-11-01
Created: 2024-11-01 21:39
Updated: 2024-11-01 22:05

These are comparison charts of US stock market indices, viewed lightly for observation purposes.
The US stock market began its ascent in October 2022, experienced a correction in the third quarter of last year, and has continued its upward trend from late October of last year to the present.
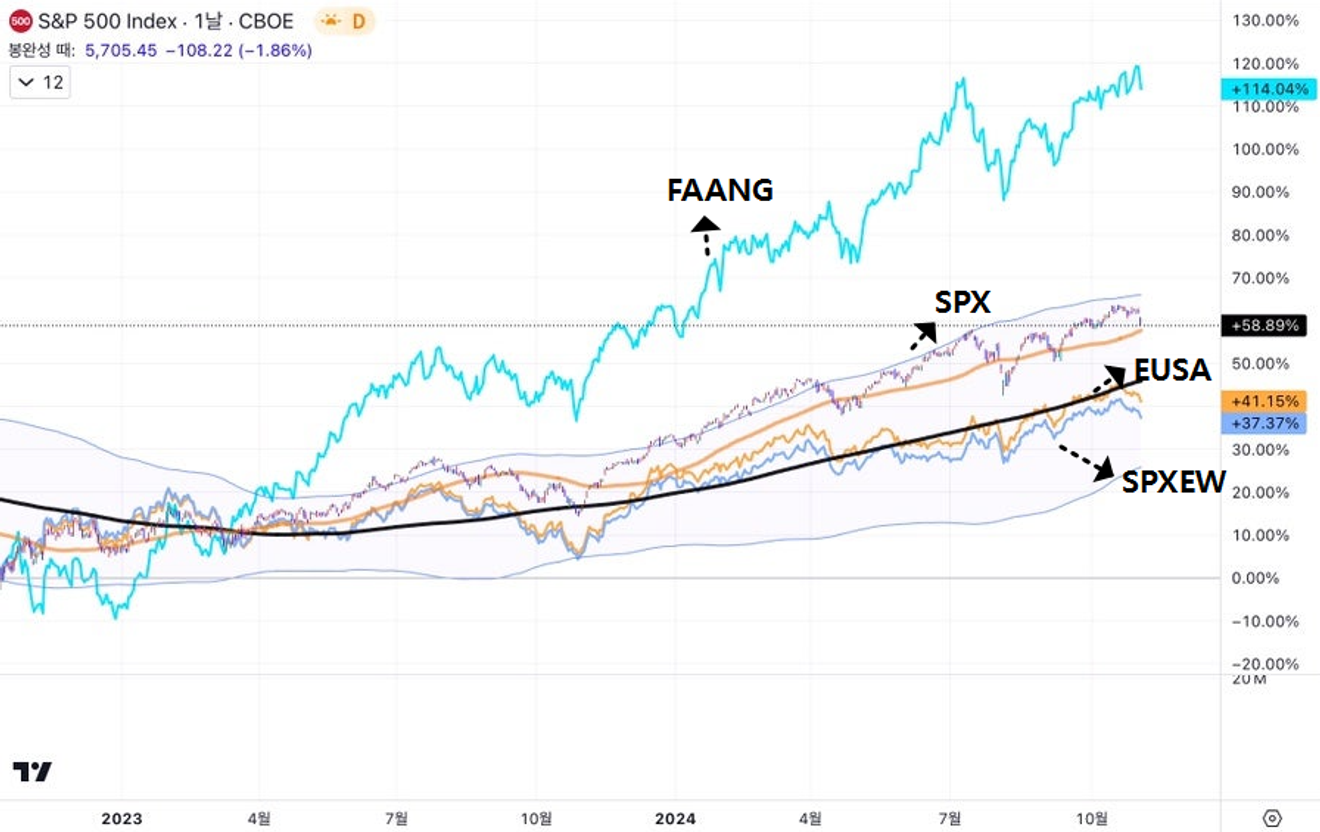
The chart below compares the price movements of the S&P 500 (candlestick), a market-capitalization-weighted index, with FAANG (the top blue line), one of the ETFs reflecting the price movements of big tech stocks; SPXEW (the bottom blue line), an equal-weighted average index of the S&P 500; and EUSA (the line above SPXEW), which tracks the S&P 600 equal-weighted average index, over the past year (from late October last year to the present).
It can be confirmed that over the past year, the big tech companies, represented by the Magnificent 7, have been the clear drivers of the S&P 500 index.
Naturally, the other equal-weighted average indices, which reflect a higher weighting of stocks other than these, are bound to be below the candlestick chart.
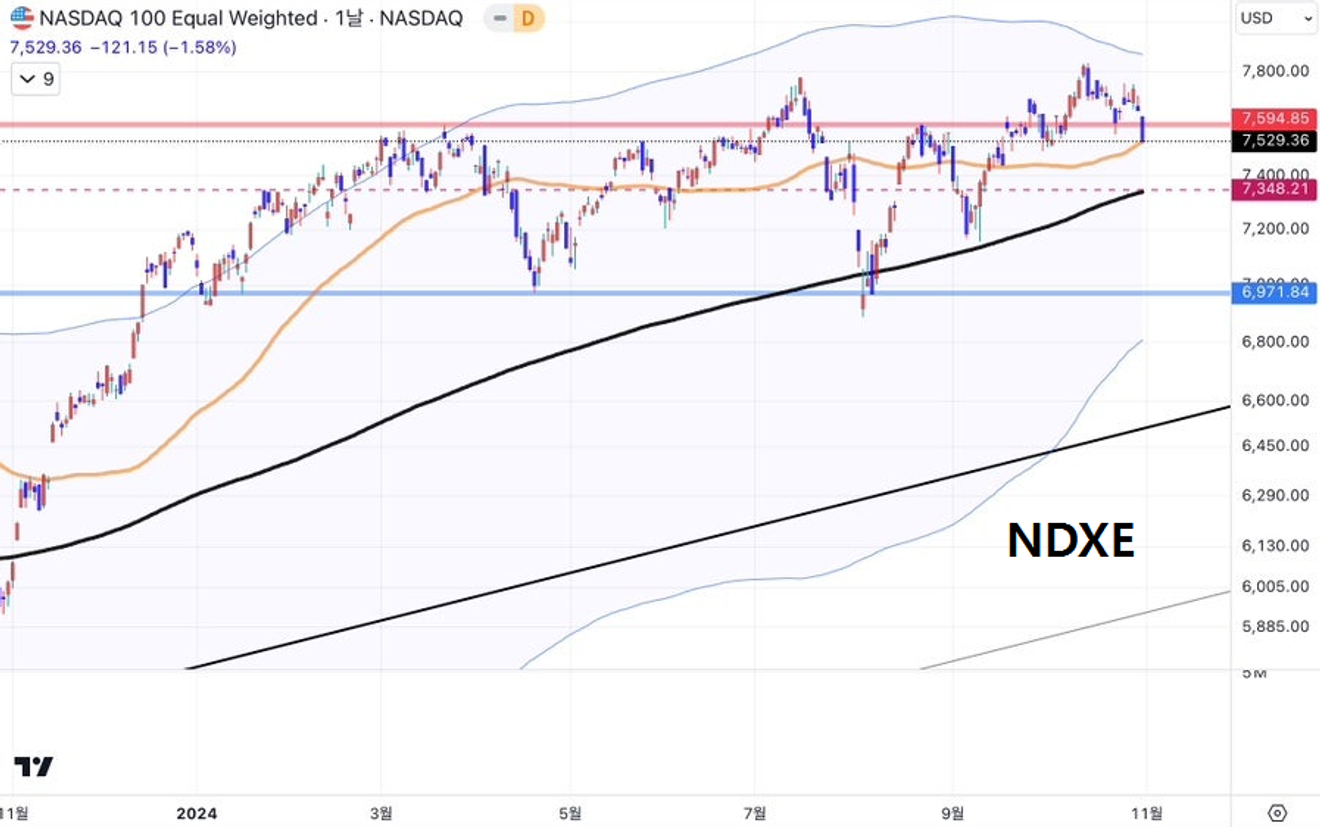
Meanwhile, below is the NDXE, an index that tracks the equal-weighted average of the prices of stocks included in the Nasdaq 100 index, which is not included in the chart above.
The NDXE shows a trend of failing to decisively renew its high since it peaked in March. Considering that the big tech companies continued to rise even after March, this suggests that the overall large-cap technology stocks included in the Nasdaq 100 have remained largely stagnant since then.
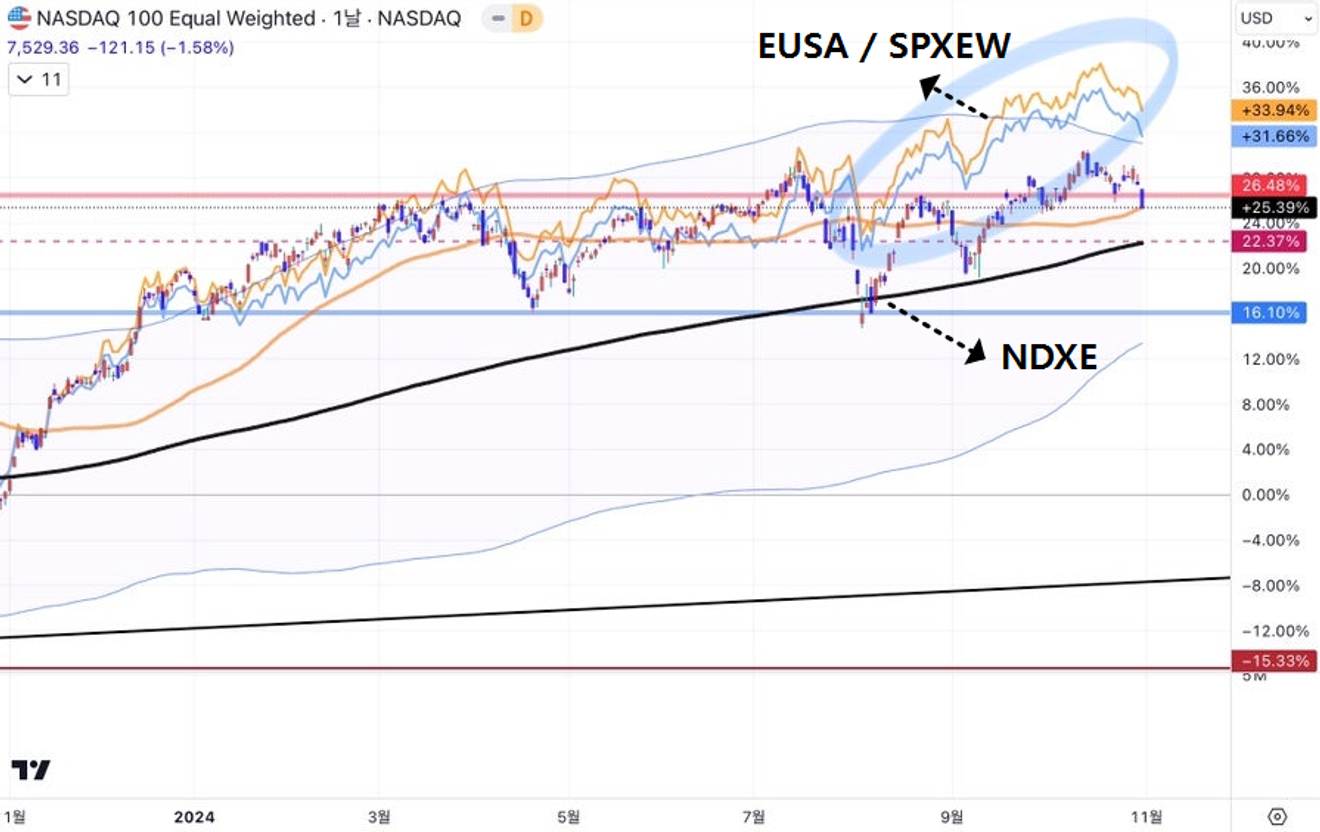
Meanwhile, below is a chart comparing the NDXE index (candlestick) with the SPXEW and EUSA indices, which were examined earlier, added as line charts.
From late October of last year, the NDXE and other indices moved almost in sync until before July this year, but suddenly diverged between late July and early August.
Considering the definitions of each index, this difference means that between late July and early August, "non-tech large-cap stocks" performed significantly better than technology stocks included in the Nasdaq 100.
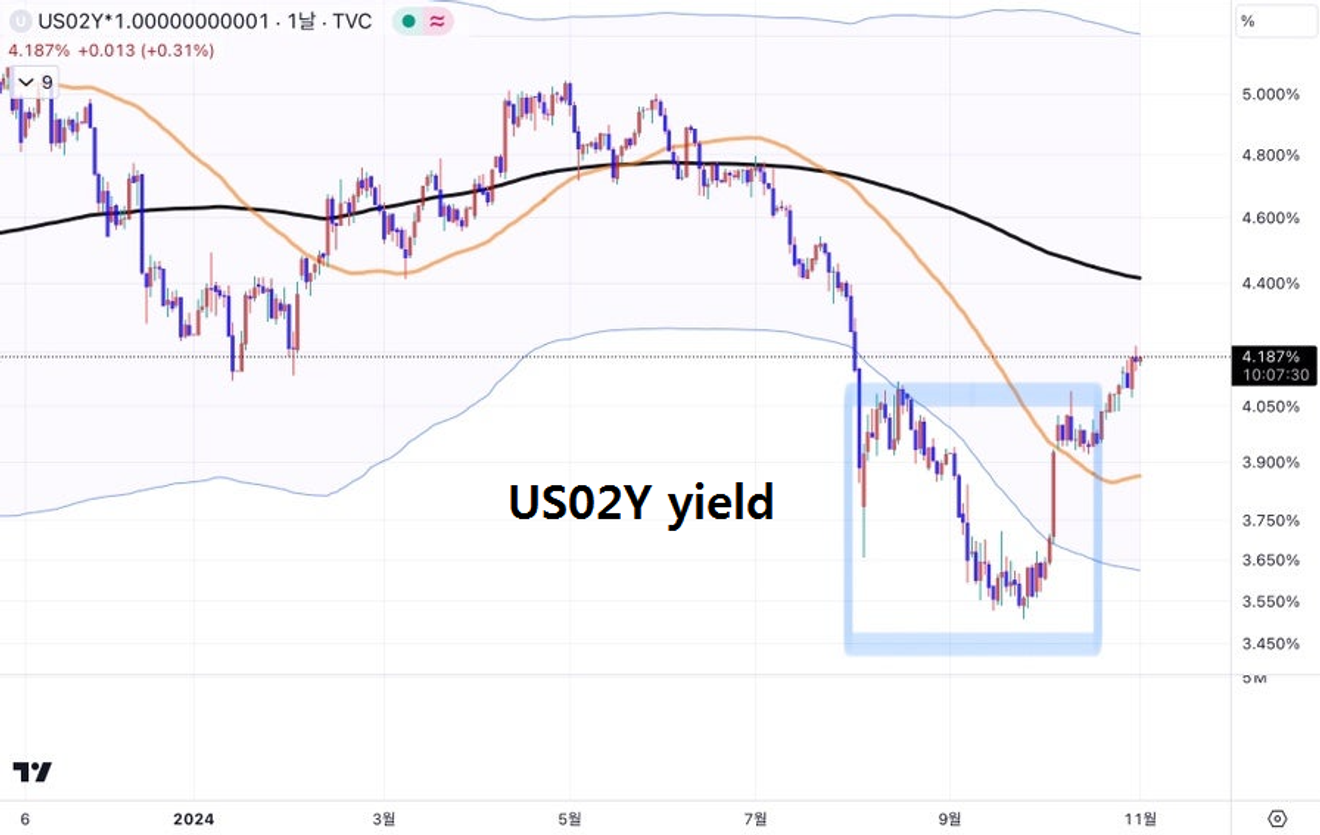
This was, of course, due to the subsequent shift in the Fed's stance on interest rates.
The chart below shows the 2-year Treasury yield, which, unlike T-bills, differs somewhat from the movement of the benchmark interest rate but is significantly influenced by the benchmark interest rate outlook.
The period marked below, when market expectations for interest rate cuts began amid concerns about short-term recession, was when non-tech stocks outperformed tech stocks. The anticipation of future interest rate cuts drove funds into these sectors in a short period.
And recently, market interest rates are rising again. What kind of reversal will this create in the trend of the US stock market?
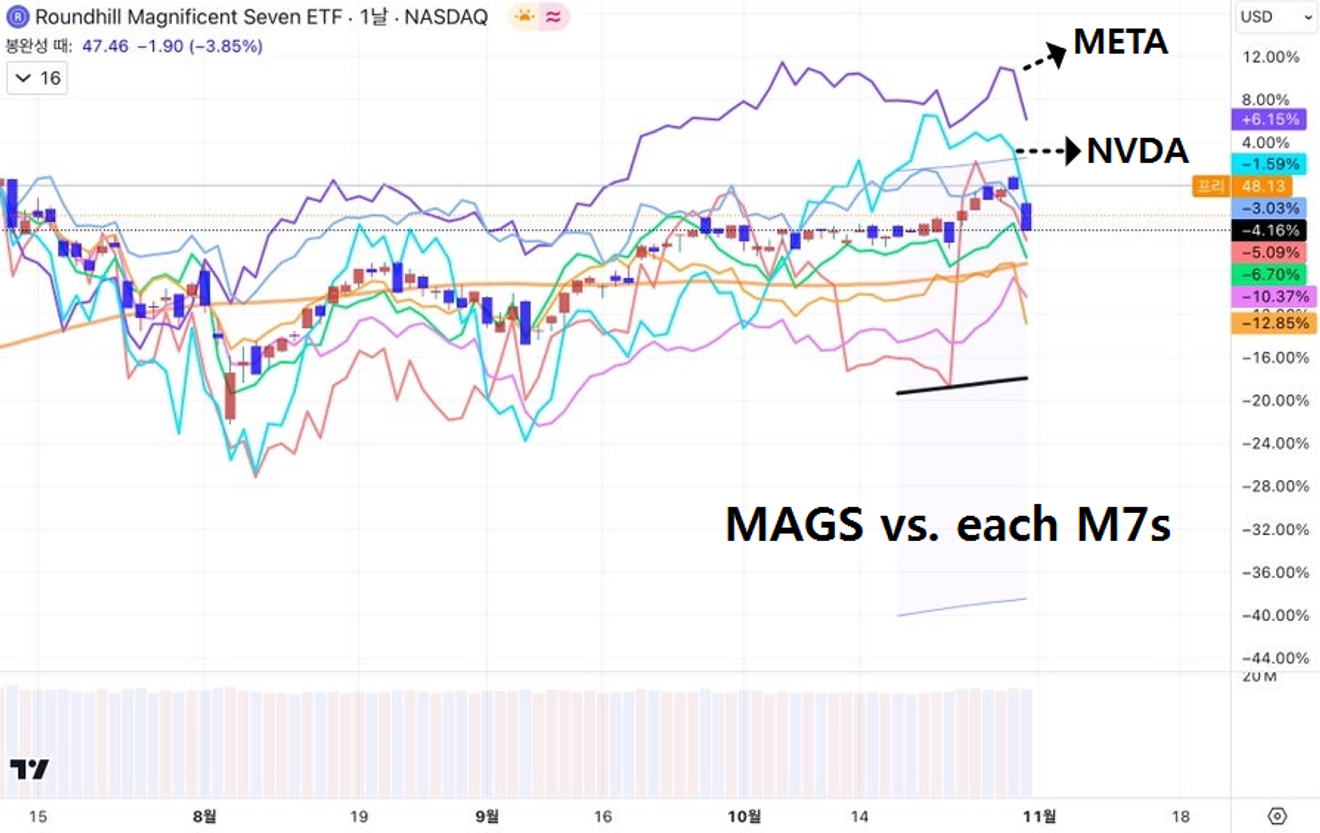
The chart below is somewhat unrelated to the previous discussion, but it compares the MAGS ETF (candlestick), which reflects the average price of M7 stocks, with the price movements of each M7 stock from the beginning of July to the present.
During this period, the top line, Meta Platforms (Facebook), showed a particularly strong relative performance. Just below is Nvidia's price movement.
Considering that the lingering factor from mid-July to the present was the "AI skepticism" regarding the short-term profitability of AI-related companies relative to investment, it can be interpreted that these two stocks were least affected by this skepticism. Of course, Nvidia is a semiconductor company that directly benefits from infrastructure investments, so it differs somewhat from companies like Microsoft and Meta that pursue AI services based on this.
Hmm... it would be good to see later how the relative price movements of each big tech company during this period will affect the relative performance in the next period. I've just included these charts for a preliminary look.
February 24, 2025
April 15, 2024
October 15, 2024
February 26, 2024
November 17, 2024
June 16, 2025
Comments0