Subject
- #KOSDAQ
- #US Stock Market
- #KOSPI
- #Global Stock Market
- #Stock Prices
Created: 2024-10-18
Created: 2024-10-18 12:39

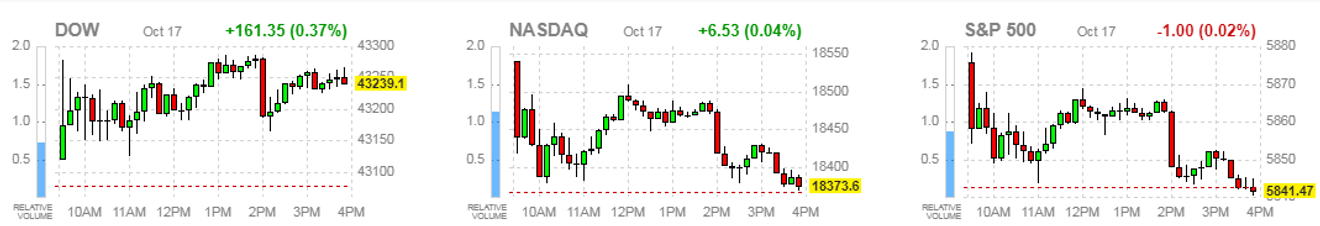
Yesterday, TSMC (Taiwan Semiconductor Manufacturing Company), a key player in AI semiconductor production, announced its best-ever performance, injecting positive sentiment into the global stock market.
As a result, the US stock market also opened strongly yesterday, with gains led by Nvidia and other Nasdaq stocks. However, the tech sector gains were partly reversed in the latter half of the session, resulting in a mostly flat or mixed finish.
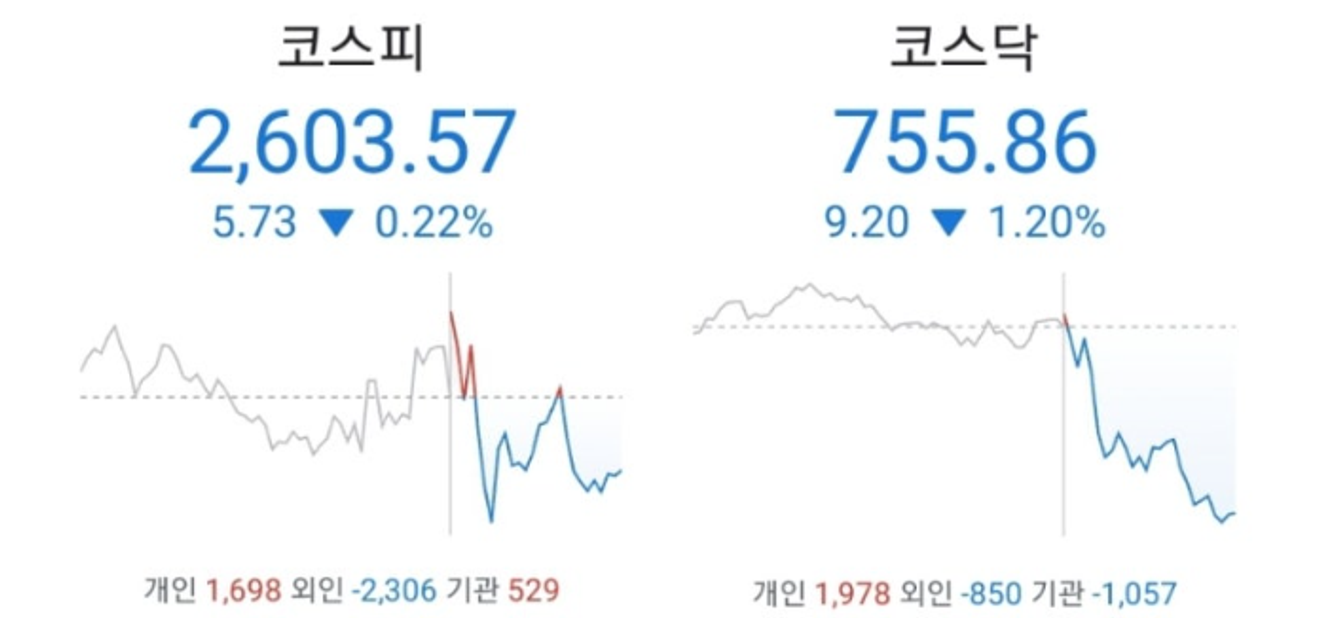
Currently, despite the positive impact of TSMC's strong results, the Korean market opened flat and has since trended slightly downwards, showing some weakness. This is nothing unusual for our market, so many might not find it surprising.
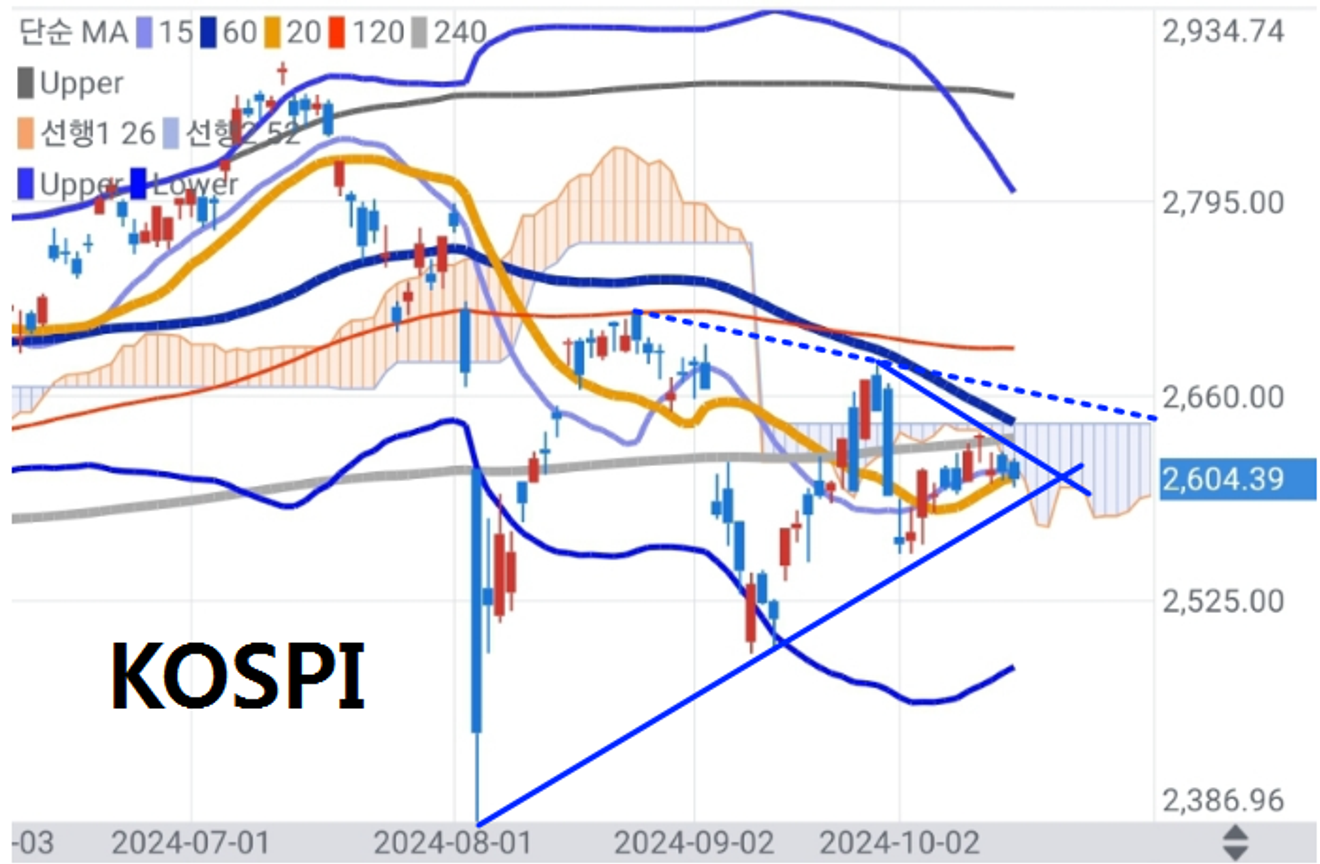
Looking at the daily KOSPI index chart below, we see that after a sharp drop in early August, it has fluctuated significantly, forming a kind of converging triangle pattern with a narrowing price range. Yesterday, while browsing YouTube, I briefly saw part of a video from a large channel suggesting that the lower trendline (support line) shown in the chart below is unlikely to be broken, and that the index will soon break through to the upside.
Is that true...? Of course, the KOSPI chart hasn't yet decisively broken through either trendline.
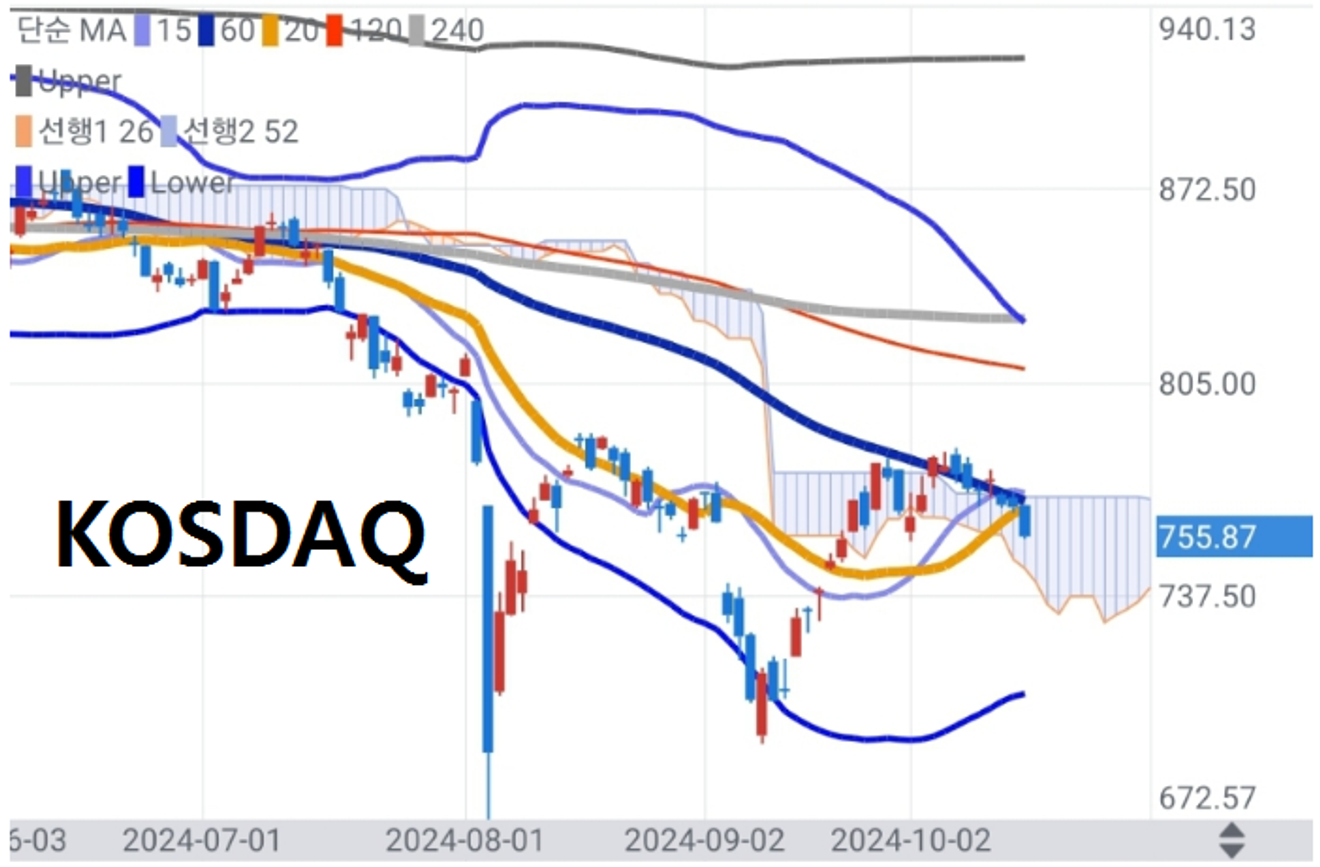
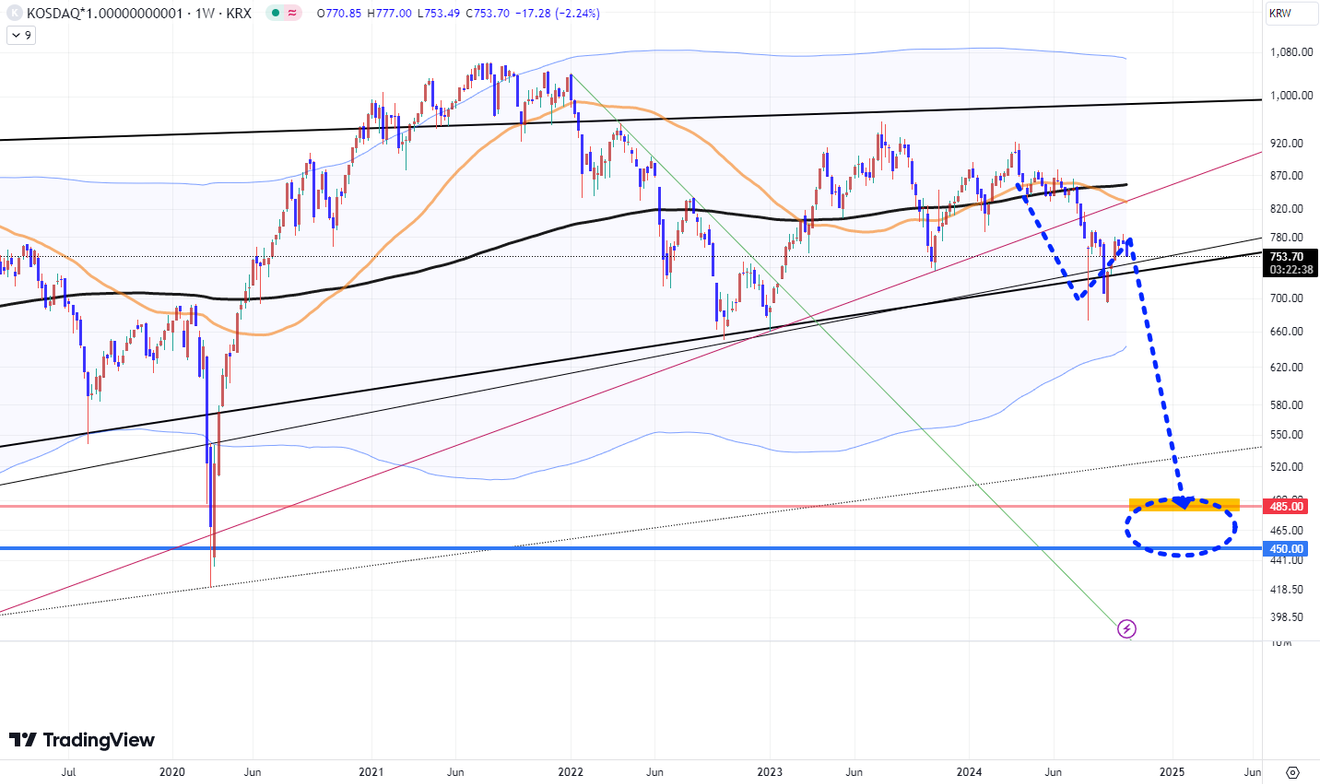
Meanwhile, the KOSDAQ index shows a similar but slightly different trend. Similar to the KOSPI, it's struggling to overcome the downward slope of the 60-day moving average, often called the supply line, and is teetering on further decline.
If the KOSPI index breaks below the lower trendline, the KOSDAQ is likely to experience further declines as it continues to struggle against the 60-day moving average resistance. Based on these two indices alone, it's too early to determine which direction is more likely; more observation is needed.
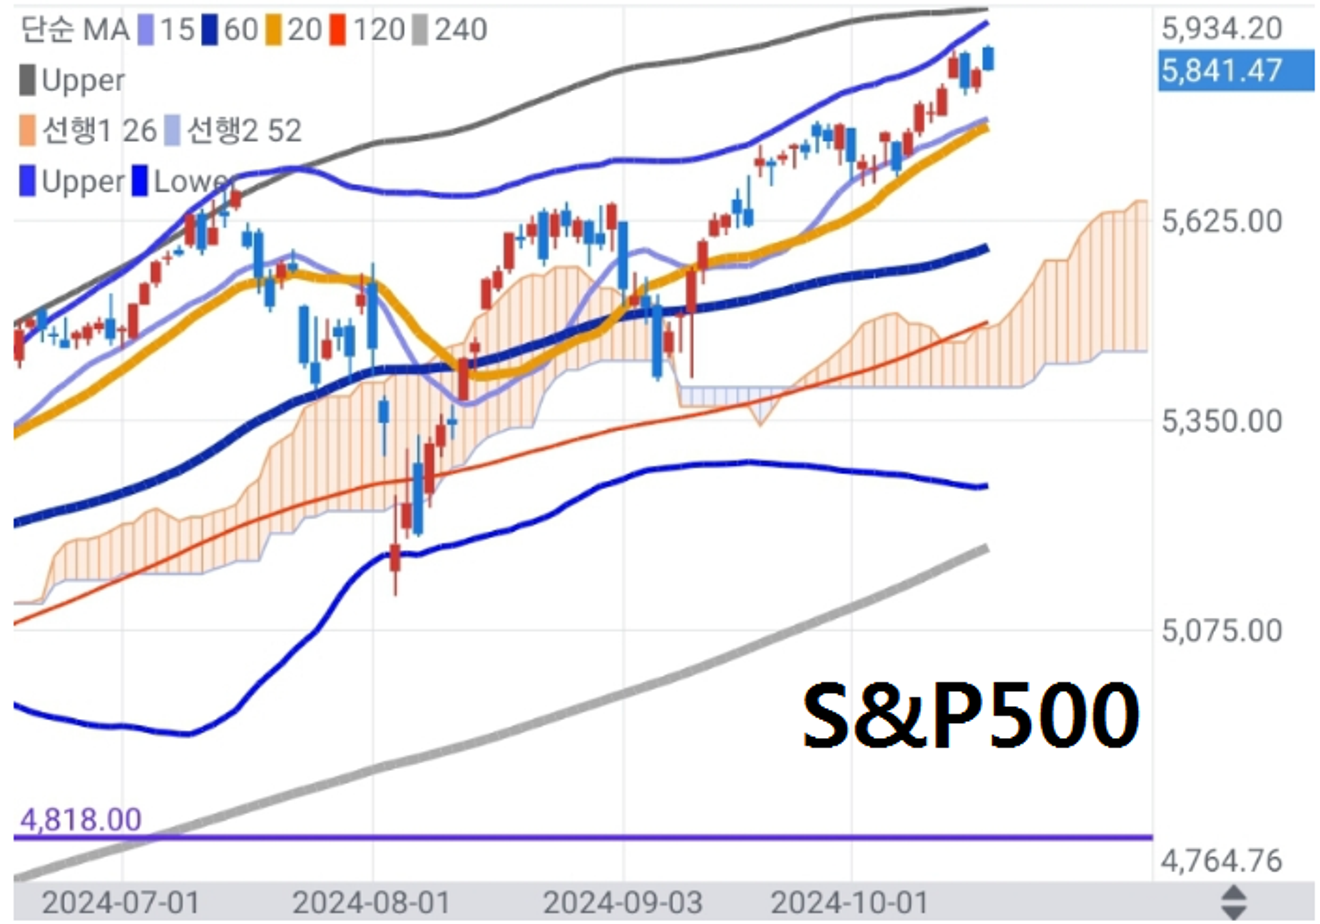
Meanwhile, below is the S&P 500 index, a leading indicator of the US stock market, which continues to demonstrate exceptionally strong performance compared to domestic and global markets. Listening only to Nvidia's confident statements and TSMC's strong results yesterday might lead one to believe that the current momentum is strong and will continue.
The S&P 500 chart below seems to show a completely different trend from the KOSPI, KOSDAQ, and other domestic indices. However, upon closer examination, the differences aren't so clear. In market economies where major US capital flows freely (excluding countries like China that heavily control foreign capital), stock indices tend to show correlated movements, with only the direction and degree of upward or downward trends varying based on individual country circumstances.
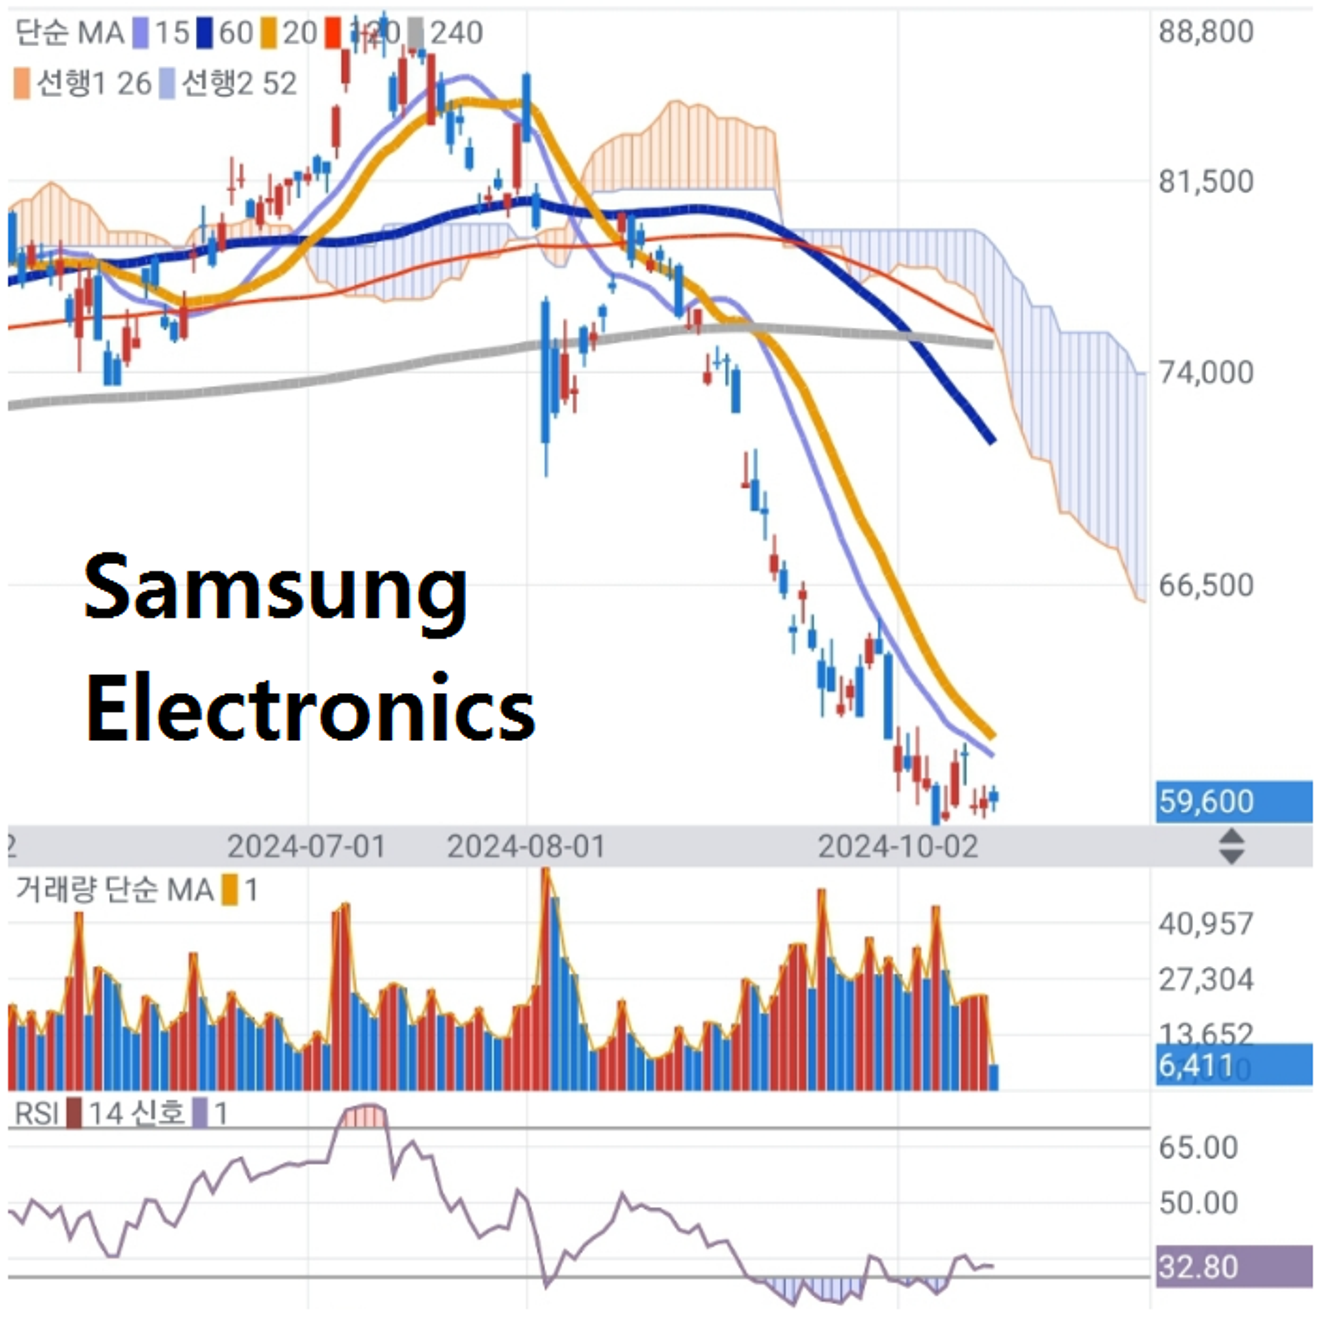
Samsung Electronics' stock price may seem completely disconnected from the S&P 500, KOSPI, and KOSDAQ, but it should be viewed within the context of the overall correlation, with the US considered strong, KOSPI/KOSDAQ as moderately weak, and Samsung Electronics as relatively weak. While this might not apply to smaller stocks, a market leader and global player like Samsung Electronics ultimately reflects the collective assessment and relative adjustments made by global investors.
The US stock market, particularly its three major indices, appears to be showing exceptionally strong performance with no apparent weaknesses. However, it did receive a significant blow the day before yesterday.
The chart below shows the Philadelphia Semiconductor Index. On Tuesday, concerns about ASML's performance led to a sharp drop, creating a large bearish candle for the semiconductor index. This large bearish candle made it difficult to quickly surpass the recent short-term high.
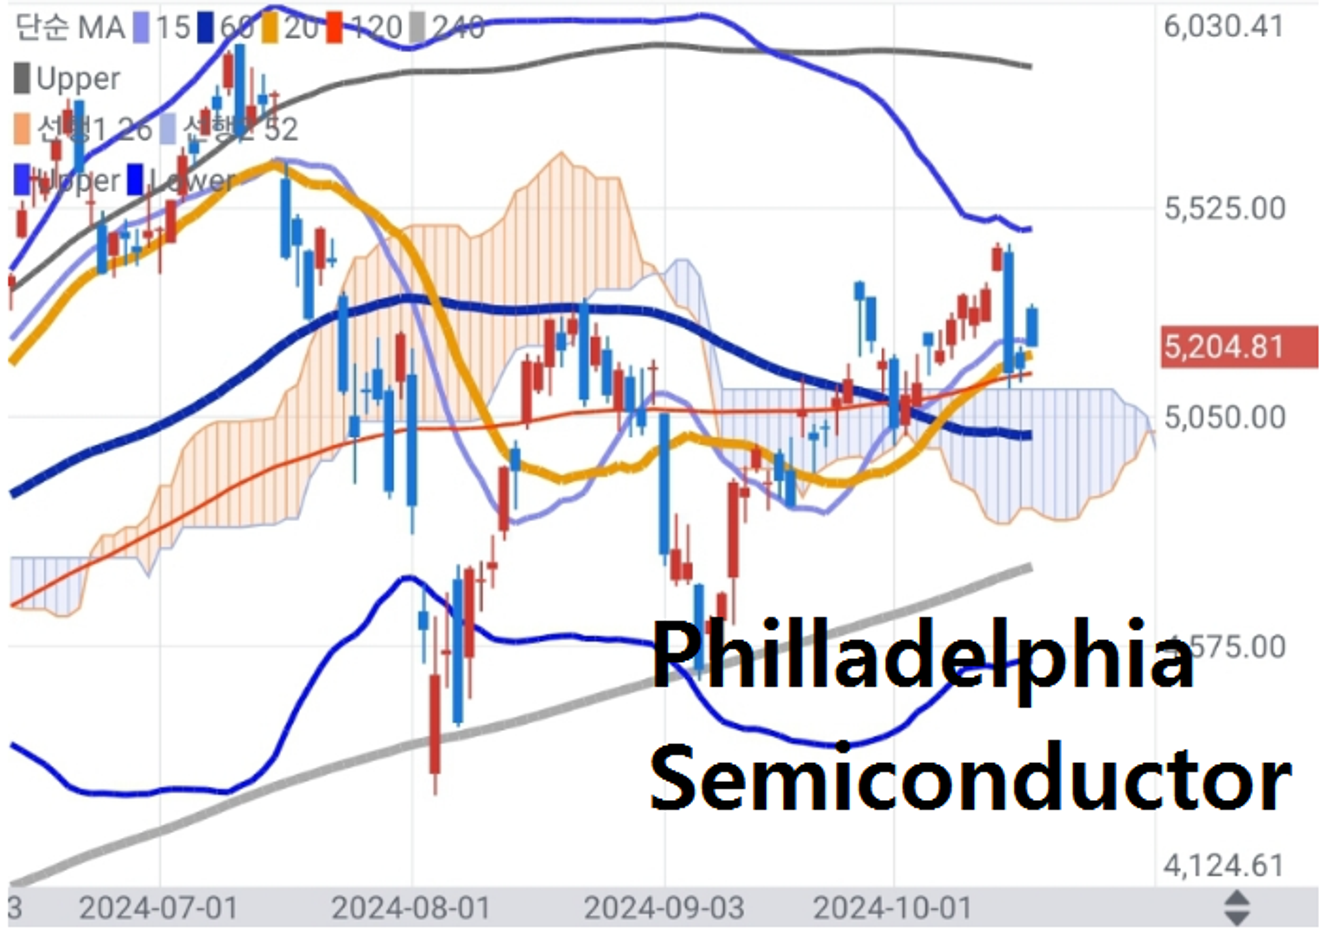
For months, I've repeatedly mentioned that the US stock market, specifically around this index level, could reach the long-term peak region. This doesn't necessarily mean an immediate prolonged bear market, but it suggests that the engine driving the long-term upward trend in the US market, a belief that has long been held, could be stalling. In other words, even without an immediate plunge into a prolonged bear market, the ceiling might be reached.
While sector and individual stock performance may differ, the long-term buy-and-hold strategy using ETFs that track major indices is becoming less likely to succeed. This is even more true for leveraged products like SOXL and TQQQ. I believe the golden age of buy-and-hold strategies for 3x leveraged ETFs like SOXL and TQQQ, which were popular among foreign investors in Korea, is over. Now, trading these requires a swing trading approach with careful selection of entry and exit points.
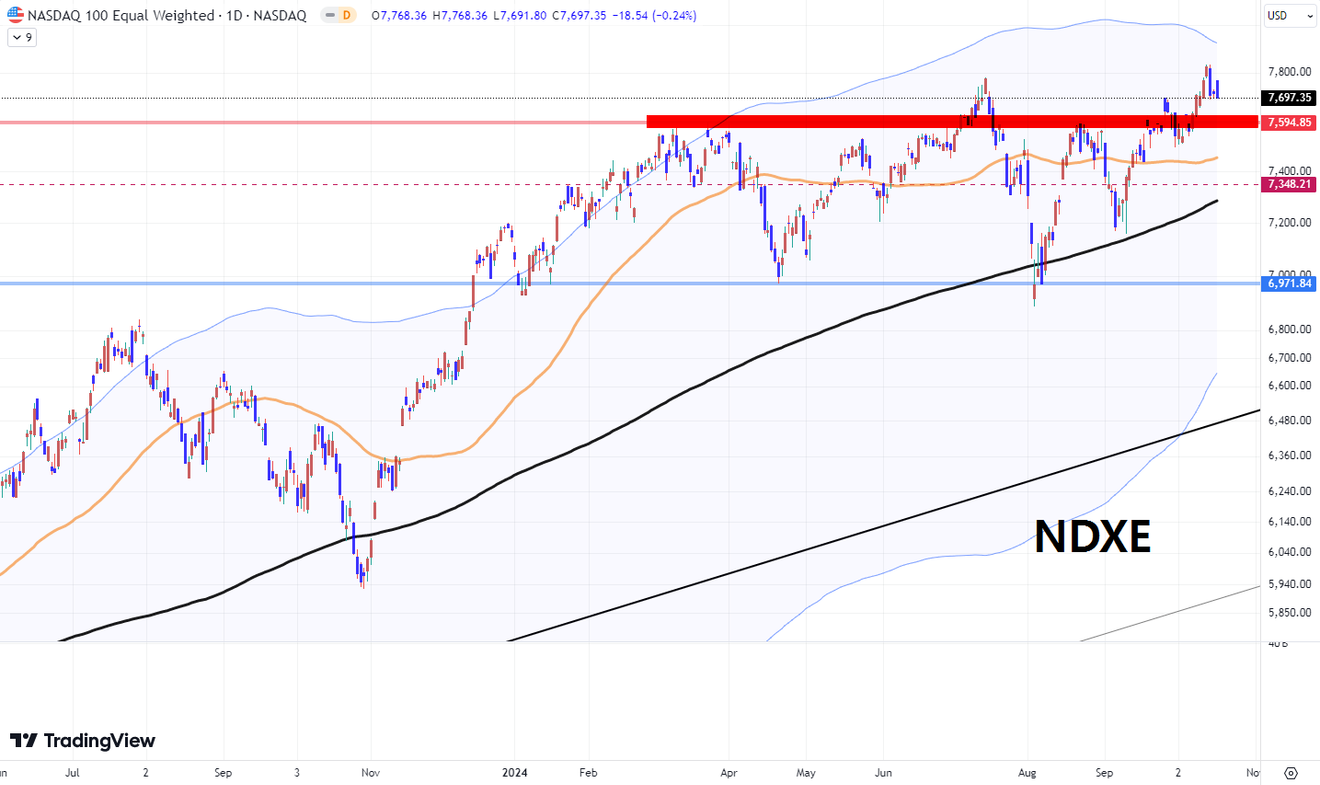
The three major indices, primarily focused on large-cap stocks and a select few sector leaders, have managed to eke out further gains since the spring of this year. However, the Nasdaq 100 Equal Weighted Index (NDXE), shown in the chart below, hasn't significantly surpassed its March high.
The Nasdaq 100, representing a group of large-cap tech stocks within the US stock market, shows that since March, the US market has been driven by a very small number of stocks, including the so-called "Magnificent Seven" (M7).
For months, I've repeatedly mentioned that the US stock market, specifically around this index level, could reach the long-term peak region. This doesn't necessarily mean an immediate prolonged bear market, but it suggests that the engine driving the long-term upward trend in the US market, a belief that has long been held, could be stalling. In other words, even without an immediate plunge into a prolonged bear market, the ceiling might be reached.
While sector and individual stock performance may differ, the long-term buy-and-hold strategy using ETFs that track major indices is becoming less likely to succeed. This is even more true for leveraged products like SOXL and TQQQ. I believe the golden age of buy-and-hold strategies for 3x leveraged ETFs like SOXL and TQQQ, which were popular among foreign investors in Korea, is over. Now, trading these requires a swing trading approach with careful selection of entry and exit points.
The three major indices, primarily focused on large-cap stocks and a select few sector leaders, have managed to eke out further gains since the spring of this year. However, the Nasdaq 100 Equal Weighted Index (NDXE), shown in the chart below, hasn't significantly surpassed its March high.
The Nasdaq 100, representing a group of large-cap tech stocks within the US stock market, shows that since March, the US market has been driven by a very small number of stocks, including the so-called "Magnificent Seven" (M7).
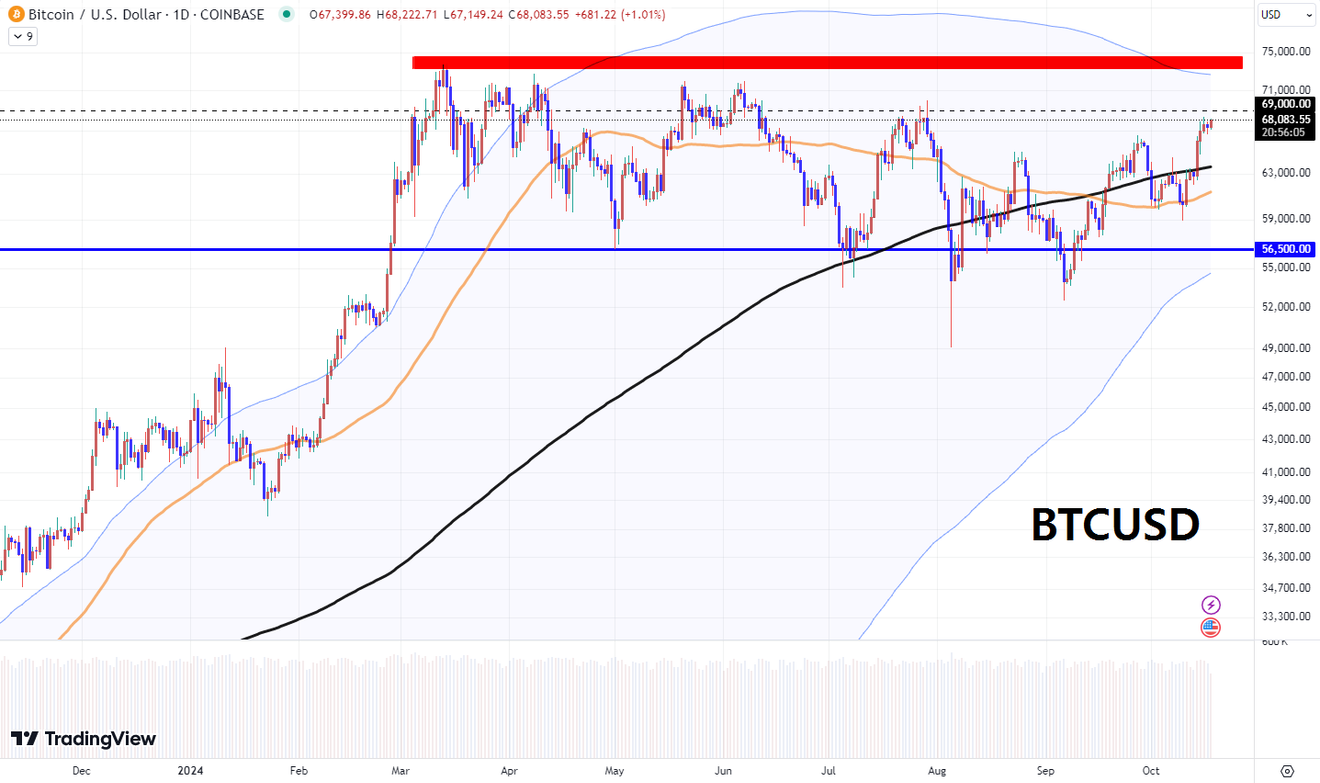
Looking at Bitcoin, a similar financial asset, we see a slightly weaker trend than the Nasdaq 100 Equal Weighted Index. The BTCUSD (Bitcoin/US Dollar) price hit a high in March and is still below that level.
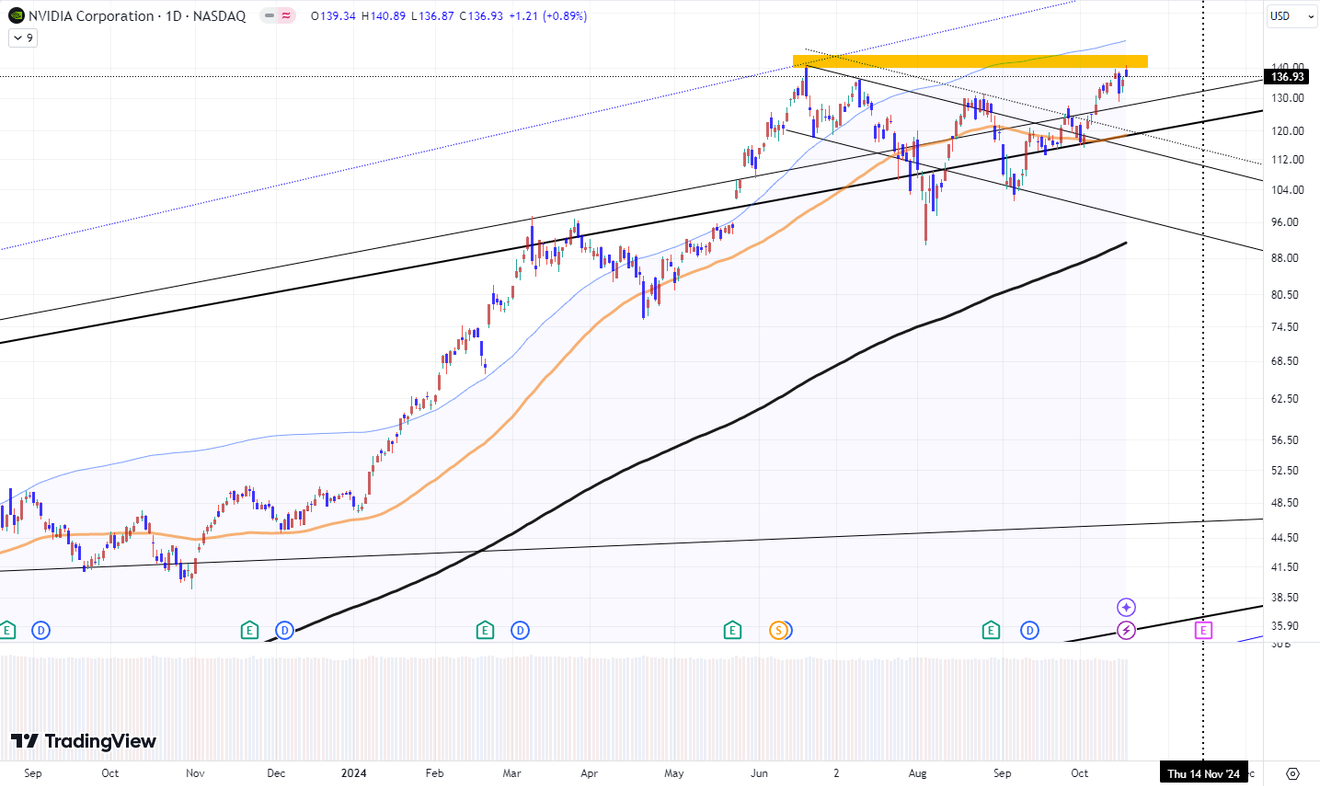
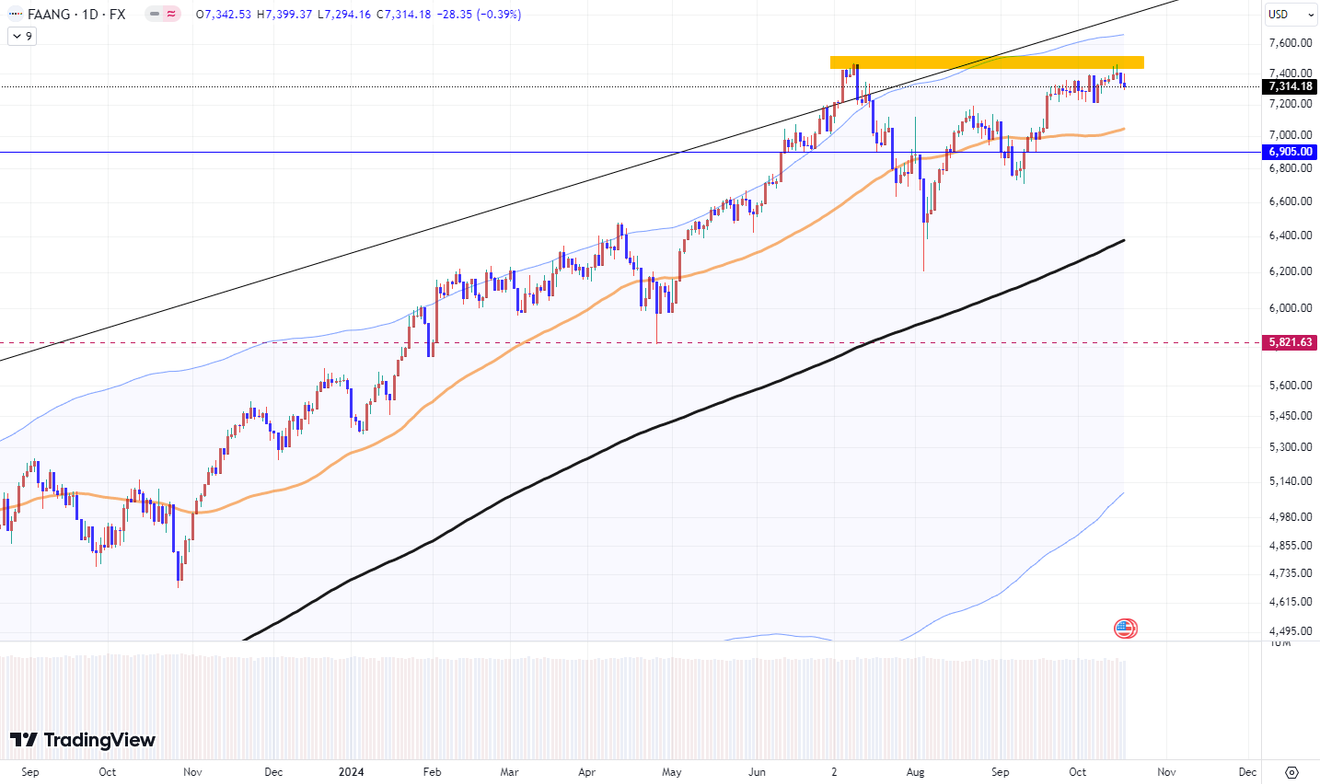
What about the leading Big Tech companies? Below is a daily chart of Nvidia, a flagship stock among the M7 Big Tech companies, and the FAANG index ETF, which encompasses other Big Tech stocks.
Big Tech stocks aside, other large technology companies within the Nasdaq 100, including Bitcoin (BTC), which had previously led the market, peaked in March and have yet to recover. Nvidia and FAANG stocks, the leading US stocks, hit a high point in early to mid-July, retreated, and are now regaining ground, almost reaching those previous highs.
Now, let's reconsider the trends of the KOSPI, KOSDAQ, Samsung Electronics, and the S&P 500 indices in light of what we've just discussed. I believe you'll have a general understanding of what I'm trying to convey.
For example, as seen in the weekly chart below, I suggest that the KOSDAQ index is likely on a path to reach that region in the coming weeks. If the KOSDAQ follows this trajectory, it suggests that, from a broader perspective, the global market remains on a path towards a major downturn.
February 24, 2025
November 17, 2024
January 16, 2025
August 20, 2024
November 23, 2024
February 12, 2025
Comments0