Subject
- #Unemployment Claims
- #US Unemployment Rate
- #Service Industry
- #Economic Indicators
- #Employment Indicators
Created: 2024-10-20
Created: 2024-10-20 20:45
(Continued from Part 1)
Among the data related to unemployment benefit claims, we previously looked at the "number of new claims." There is also data on the number of "(2+ weeks) consecutive claims," which can be considered a bit closer to official unemployment. This can be seen as excluding only the number of people who applied for the first time from the total number of unemployment benefit claims.
The longer someone consecutively claims unemployment benefits for 2 weeks or more, the higher the possibility that they will remain a potential unemployed person, not just temporarily. The fact that consecutive claims are set at 2 weeks or more suggests that, given the high proportion of the service sector in the US, many people claim unemployment benefits for one week and then find another job the following week.
As shown in the chart below, should this be seen as a characteristic of the US industrial structure, where the service sector (Service-providing) accounts for a large portion of total employment (total nonfarm)? The proportion of services in total US jobs has continued to rise, seemingly converging to a peak of around 86% after the Global Financial Crisis.
This might explain why the US is trying to revive manufacturing jobs by pressuring foreign companies to build factories in the US through reshoring or the CHIPS and Science Act... Looking at the graph below, it is peculiar that, except for the corona pandemic, the proportion of service industries has continued to increase during past recession periods.
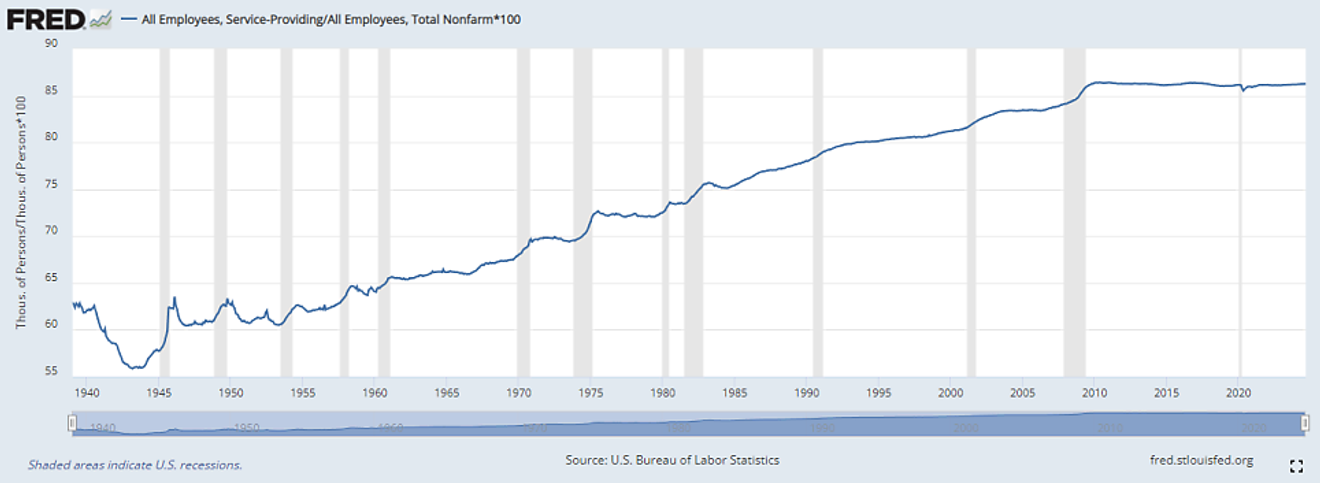
Trends in US Service Employment/Total Employment Ratio
The English text below is a translation of the various "definitions of unemployment rates" used in the US. The official unemployment rate is defined as U-3. As we move from U-1 to U-6, the scope of individuals included in the unemployment definition widens. However, in U-1, a time definition of '15 weeks' is mentioned for unemployment. As the number of people who have claimed unemployment benefits for more than 2 weeks and are approaching 15 weeks increases, we can predict that the official unemployment rate will rise in the future.
. . . . . . . . . . . . . . . . . . . . . . .
Six State Employment Indicators Measured Using the Same Criteria as the United States
The six state employment indicators based on the same definitions as those released by the United States are as follows:
U-1: Proportion of people unemployed for 15 weeks or more: The proportion of people unemployed for 15 weeks or more compared to the total civilian labor force (economically active population).
U-2: Proportion of people who have lost their jobs or whose temporary jobs have ended: The proportion of people who have lost their jobs or whose temporary jobs have ended compared to the total civilian labor force.
U-3: Total unemployment rate: The ratio of the total number of unemployed people to the total civilian labor force, and is the indicator used for the official unemployment rate.
U-4: Proportion of total unemployed and discouraged workers among the non-economically active population: The ratio of the total unemployed and discouraged workers to the total of the civilian labor force and discouraged workers.
U-5: Proportion of total unemployed, discouraged workers, and other marginal labor force: The ratio of the total unemployed, discouraged workers, and other marginal labor force to the total of the civilian labor force and other marginal labor force.
U-6: Proportion of total unemployed, all marginal labor force, and those working part-time for economic reasons: The ratio of the total unemployed, all marginal labor force, and those working part-time for economic reasons to the total of the civilian labor force and all marginal labor force.
. . . . . . . . . . . . . . . . . . . . . . .
Now, let's compare the monthly number of unemployed and the number of "consecutive claims" of 2 weeks or more. The graph below compares the monthly number of unemployed and the number of consecutive claims during the pre-corona period.
Consecutive claims, while using the same weekly data, show a smoother graph than the number of new claims. This indicates that there are surprisingly many cases of only applying for one week, and that those who apply for more than two consecutive weeks tend to claim unemployment benefits for a longer period of more than two weeks.
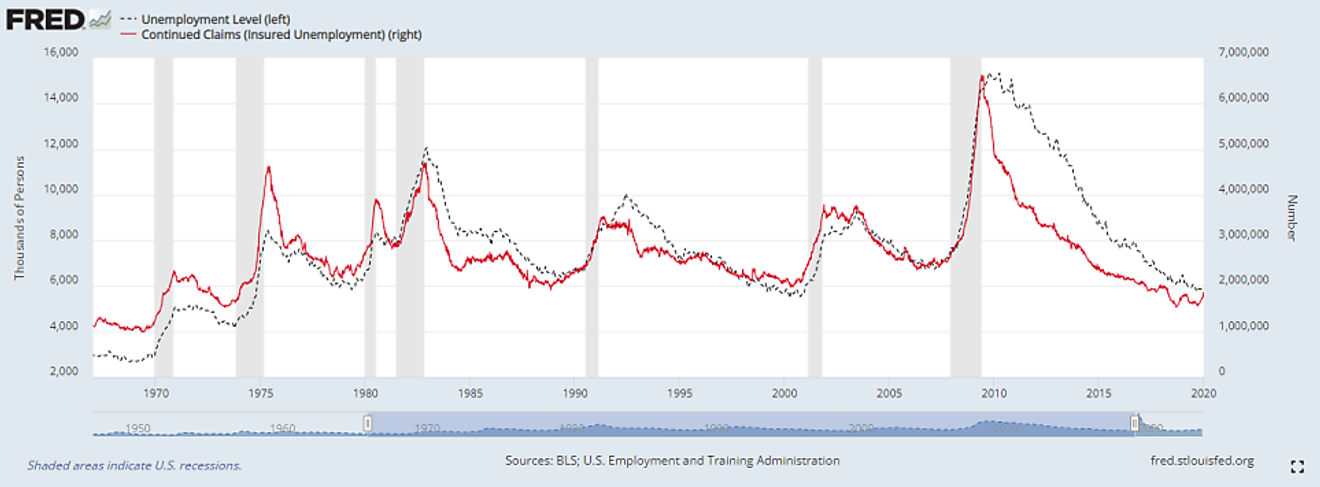
Unemployed, Continuous Claims (2+ weeks) (Pre-COVID-19)
Below, the 4-week moving average of the consecutive claims is added as a yellow line. Since the difference is minimal, in a long-term graph, the 4-week moving average line, which is set to the thickest line, covers the line of weekly consecutive claims.
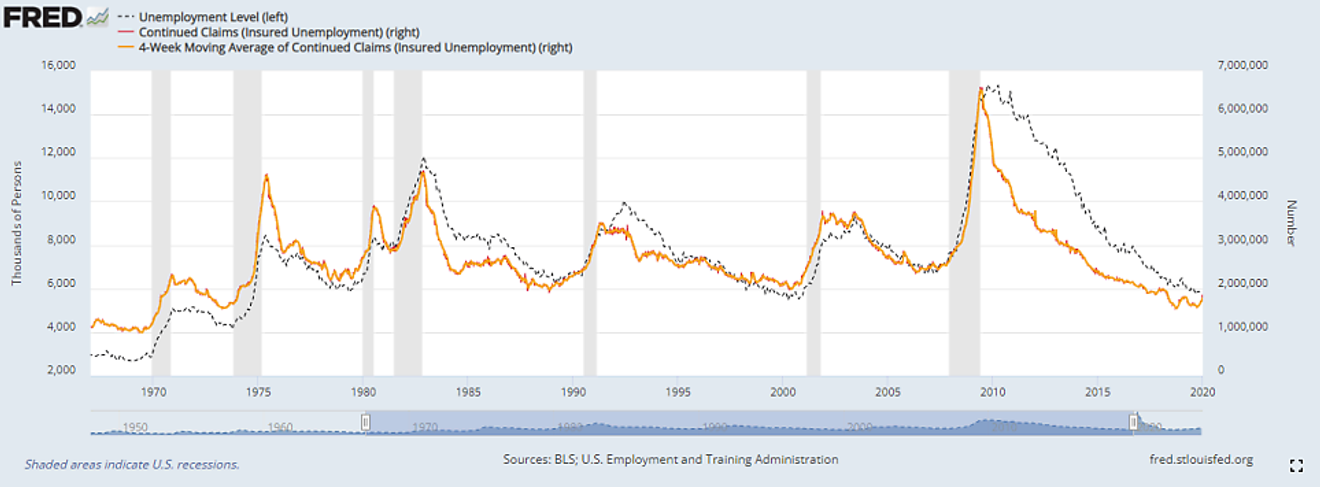
Unemployed, Continuous Claims, 4-Week MA of Continuous Claims (Pre-COVID-19)
While the yellow line representing the 4-week moving average appears to completely cover the thin red line of weekly data above, by zooming in on a specific section as shown below, you can clearly see that each line moves with slight differences.
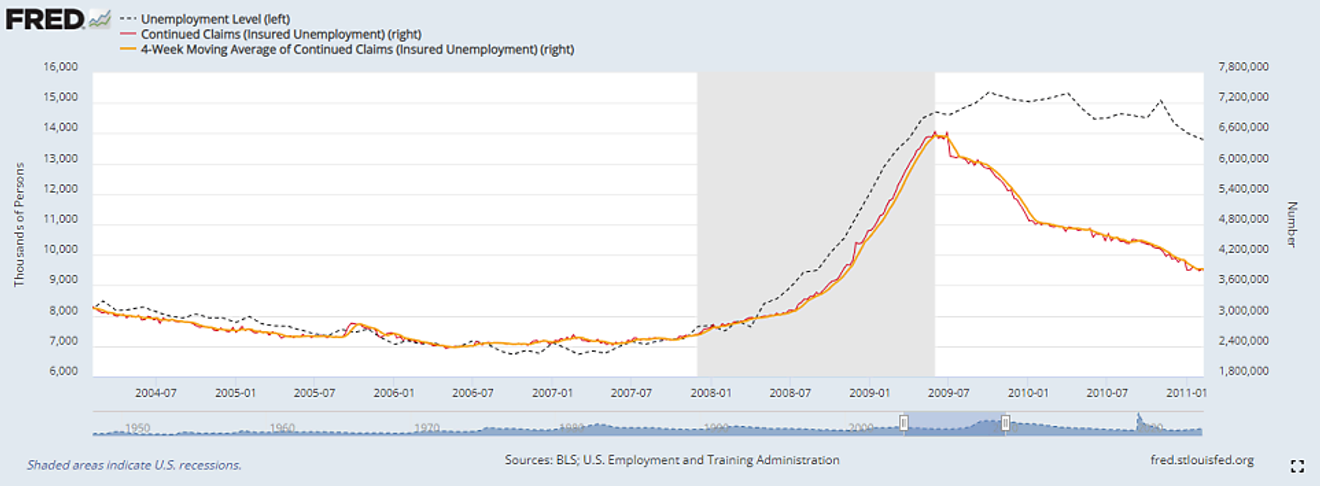
Unemployed, Continuous Claims, 4-Week MA of Continuous Claims (Pre-COVID-19, Partial Zoom)
The graph below shows the monthly number of unemployed, weekly new benefit claims, and weekly consecutive benefit claims for the entire pre-corona data period.
For the most part, the trends are similar. It seems that there is not much difference regardless of which is observed. Although weekly unemployment benefit claims data is more frequently available, looking at monthly official unemployment data or unemployment rate data would also not be a major issue.
However, at the beginning of past recessionary periods, the number of consecutive benefit claims sometimes shows a slightly faster increase than the monthly number of unemployed, and the trend of new benefit claims shows a slightly faster increase in some instances than consecutive claims.
While this is a relatively infrequent occurrence, for those who prefer to see a slightly faster trend, it may be useful to examine weekly unemployment benefit claims data in conjunction with official monthly unemployment data.
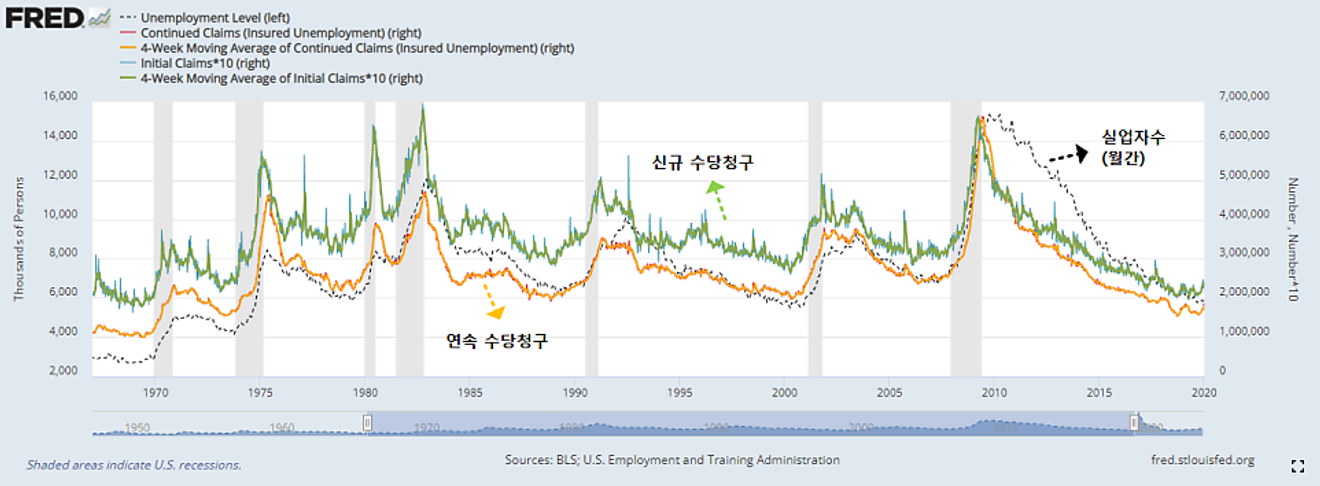
Unemployed vs. Initial Claims & MA vs. Continuous Claims & MA (Pre-COVID-19)
Below is an expanded chart of the same graph, covering the period from January 2022 to October 2024, the most recent period after the corona pandemic.
The monthly unemployment data, shown as a black dotted line, gradually increased this year, spiked significantly in July and August, but was assessed as temporary due to the hurricane at the time, and the concerns have subsided for now.
Then, the number of new benefit claims, which exceeded 260,000 last week, showed a sudden surge in the graph below compared to the previous trend. Although it fell to 240,000 the following week, the number of unemployment benefit claims, which occasionally precedes official monthly unemployment data, has spiked again, raising concerns that the official unemployment rate might also surge with a time lag.
Given that the market experienced a setback in July and August due to the unemployment rate and the "Sham's Law," the sudden increase in unemployment benefit claims, even if only for a week, has raised concerns, interpreted as a single flinch. Judging by the current actions of the US government and the situation, it seems that the US government is trying to prevent a sudden spike through policy adjustments. A prime example of this is the control of immigration...?
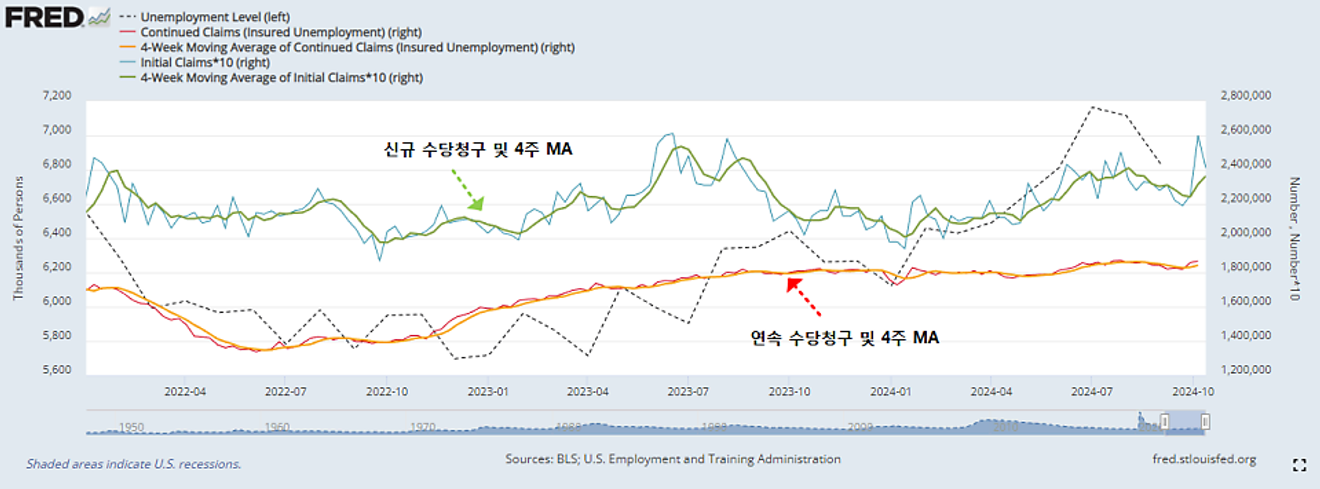
Unemployed vs. Initial Claims & MA vs. Continuous Claims & MA (Post-COVID-19, 2022~Present)
November 17, 2024
February 24, 2025
August 31, 2024
Invalid Date
July 8, 2024
April 26, 2024
Comments0