Subject
- #Establishment Survey
- #Great Depression
- #US Employment
- #Employment Gap
- #Illegal Immigration
Created: 2024-12-08
Updated: 2025-01-09
Created: 2024-12-08 20:56
Updated: 2025-01-09 03:38

.
Last Friday was the first Friday of the month, the day the U.S. Department of Labor released its monthly nonfarm employment report.
After the November figures were released, monthly new employment (headline) came in at around 220,000, which the market considered robust. The unemployment rate rose slightly to 4.2%, rounded up, but this was seen as a continuation of the Goldilocks economy.
Below is a chart showing the trends of two key data sets related to U.S. employment (jobs): employment based on business surveys (All employees, total nonfarm, yellow solid line) and employment based on household surveys (Employment level, black dotted line).
Given the different starting points in the late 1940s, where both data sets exist simultaneously, it seems natural that the absolute figures will continue to differ.
However, I think the important thing is the change in trends over various periods since then. For reference, the current headline (main employment index) is employment based on business surveys (All Employees, total nonfarm), and this figure is what is cited in the news.
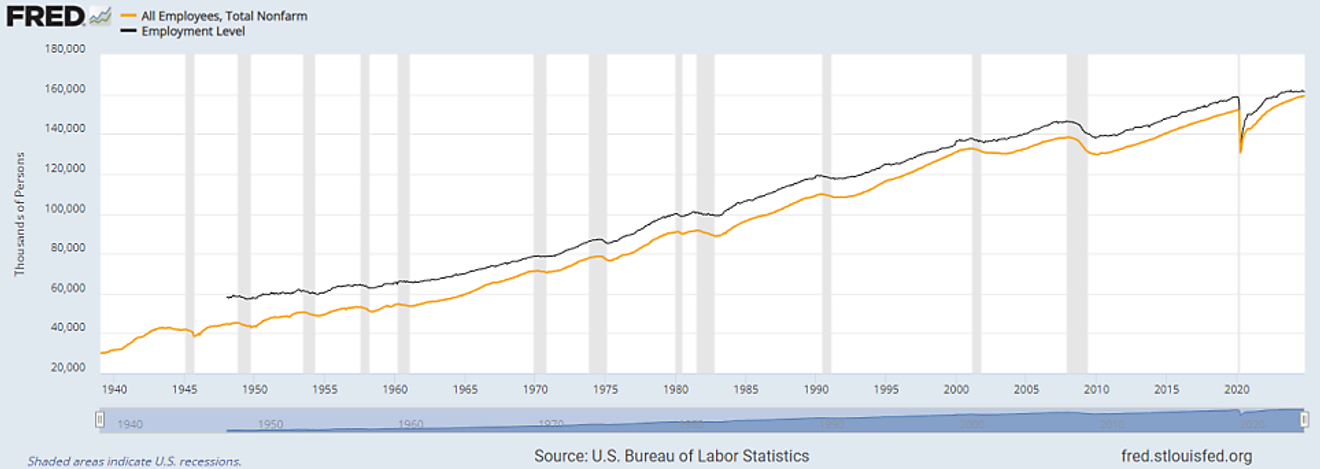
US Employment (Establishment Survey vs. Household Survey)
Meanwhile, data from household surveys are divided into employment (Employment level) and unemployment (Unemplyment level). Business surveys do not provide unemployment data, so the unemployment rate (Unemployment rate), derived from the number of unemployed, is based on household surveys.
The headline employment (business survey) and headline unemployment (rate) (household survey) that we usually see in the news have different survey bases.
The chart below shows the responses regarding employment (Employment level) and unemployment (Unemployment level) from household surveys, as well as the civilian labor force (Civilian labor force = Employment + Unemployment level), which combines the two.
The ratio of the number of unemployed to the labor force here is the unemployment rate [%].
Unemployment rate data, by its nature, can only come from household (individual) surveys. Therefore, this household survey becomes the headline, and since employment can also be obtained from company payroll records in addition to surveys, it is considered more reliable, making business surveys the headline for employment.
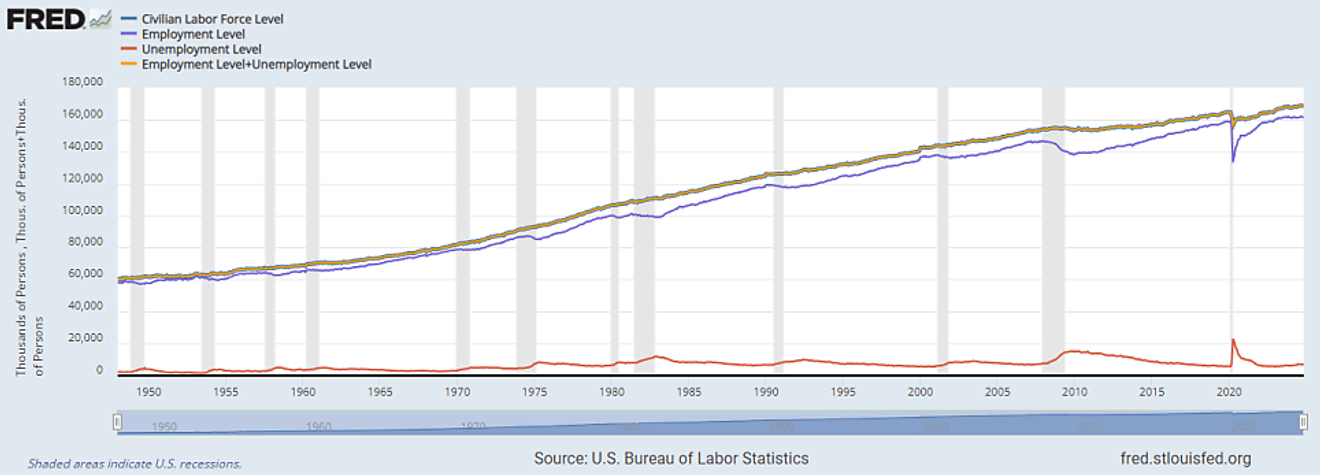
US Household Survey: Working-age Population, Employment, Unemployment
However, since the Biden administration took office, there have been many interesting discrepancies in employment-related data.
Below is a chart comparing the year-on-year [YoY] trends of employment based on business surveys (yellow line) and household surveys (black dotted line).
While the absolute figures, as seen above, will inevitably continue to differ, in a specific short-term period of a few years, the trend of change in those periods tends to converge similarly, although some minor discrepancies may appear in between.
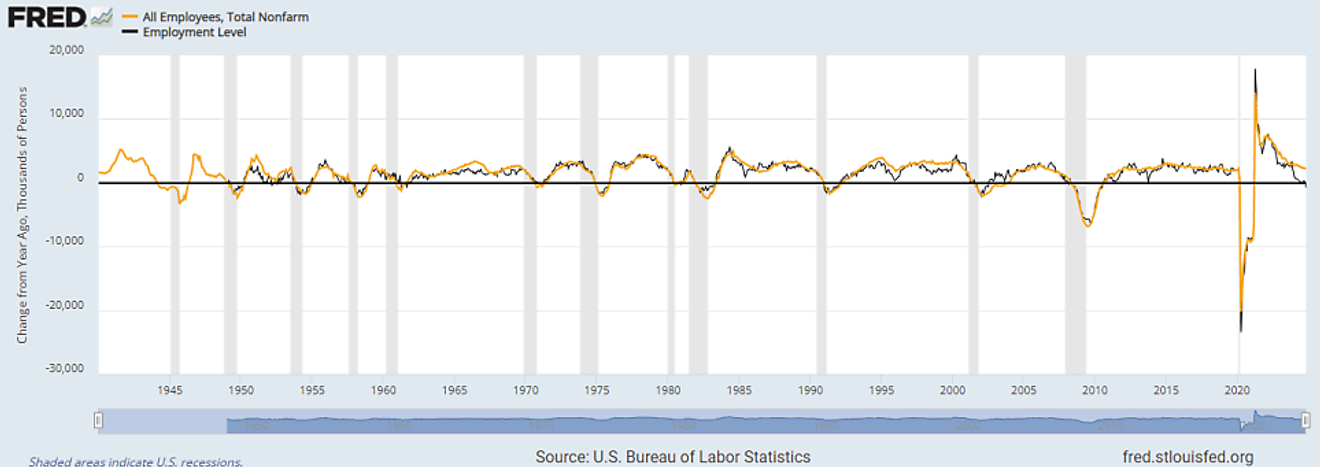
US Employment YoY Trend (Establishment Survey vs. Household Survey)
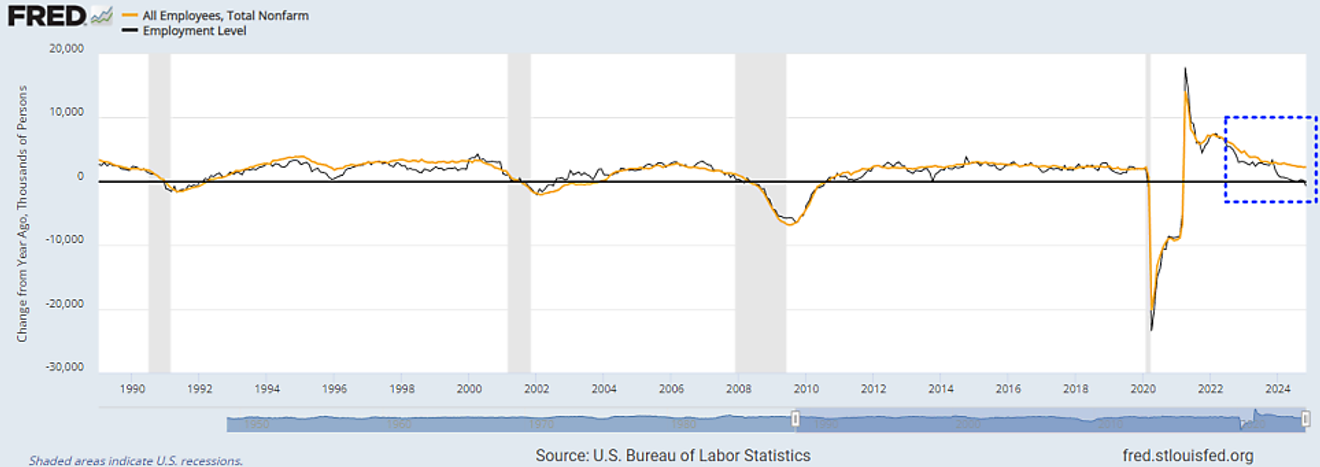
However, from around mid-2022, the year-on-year change rates between the two began to diverge, and recently, an excessive discrepancy has occurred, unlike what we have seen in past data.
Even listening to the opinions of experts through videos related to the US stock market, there have been various opinions on this. 1) Due to the decline in response rates of household surveys since the Corona crisis, 2) or due to the decline in response rates from Republican supporters since the Biden administration, 3) or due to the effect of illegal immigrants, etc...
Among these, it seems strange that there was no significant discrepancy until 2020 or 2021, when the pandemic was severe, and the discrepancy began to appear after mid-2022, making the issue of response rates since the Corona crisis seem unlikely.
And it doesn't seem appropriate to attribute it to a decrease in response rates from Republican supporters during the Biden administration, because it implies that the survey respondents were more negative about the employment situation.
Of these three, the most plausible is 3) 'the impact of illegal immigrants'.
Through news reports, you would have heard that the number of illegal immigrants increased sharply after the early stages of the Biden administration. Since the Biden administration began in January 2021, the discrepancy started appearing around the beginning to mid-2022, which seems to match the timeline. It's unlikely that illegal immigrants who have entered the country in recent years would be included in the Labor Department's survey respondents.
Then, the discrepancy that has rarely been seen in the past year could be because illegal immigrants who entered earlier have taken the place of (?) American citizens' jobs... it's a possibility we can consider.
From the overall perspective, including the effect of illegal immigration, employment is still considered healthy. However, from the standpoint of existing American citizens, the employment situation may feel like it has already entered a recession, based on past examples.
President-elect Trump, however, has repeatedly stated that he will not only block new illegal immigrants from entering the country but may also deport existing illegal immigrants as soon as his term begins.
So, what impact will this have on the U.S. job market?
For existing American citizens, it may be good that there will be fewer job competitors. However, in terms of overall quantity, there is a high likelihood of at least a significant period of contraction. Something that has been contributing positively to the American economy for a while may create room for a reversal. Seeing the extent of this impact will be a very important point to consider when gauging the future of the American economy and the stock market.
Chairman Powell recently gave a speech stating that the US economy is still good, but I believe that we should not let our guard down about the US stock market, keeping in mind that these somewhat contrived data points exist.
Comments are disabled for this post.
May 31, 2024
November 17, 2024
May 20, 2024
Invalid Date
February 24, 2025
January 19, 2025