- "금투세 폐지"…국내증시 날개 달까
- 동학개미(국내 개인투자자)들의 숙원이었던 금융투자소득세(금투세)가 마침내 폐지로 가닥이 잡혔다. 야당이 장고 끝에 금투세 폐지에 '동의'하면서, 금투세는 유예 기간 종료를 2개월 앞두고 4년 만에 사라지게 됐다. 투

News about the abolition of the Financial Investment Securities Transaction Tax (FIST) was released yesterday morning. Simultaneously, you may have noticed that US stock futures jumped at the same time.
It's unlikely that US futures jumped because of the domestic FIST. It seems that the rise in market interest rates recently might ease, given that Harris' approval rating rose to almost equal Trump's over the weekend. In any case, both effects appeared simultaneously, seemingly boosting the domestic market yesterday morning.
Of course, it's natural to think that the absence of FIST is more beneficial to the domestic stock market than its presence. However, I believe the force that has been depressing the domestic stock market for several months is something larger. This is due to the GDP shock, the decrease in exports, and the high probability of a contraction in domestic demand due to household debt. I think the FIST effect was just a short-term positive factor for a day or two.

Looking at the current positions of the KOSPI and KOSDAQ indices, it is questionable whether yesterday's rebound in the domestic stock market was actually due to the FIST.
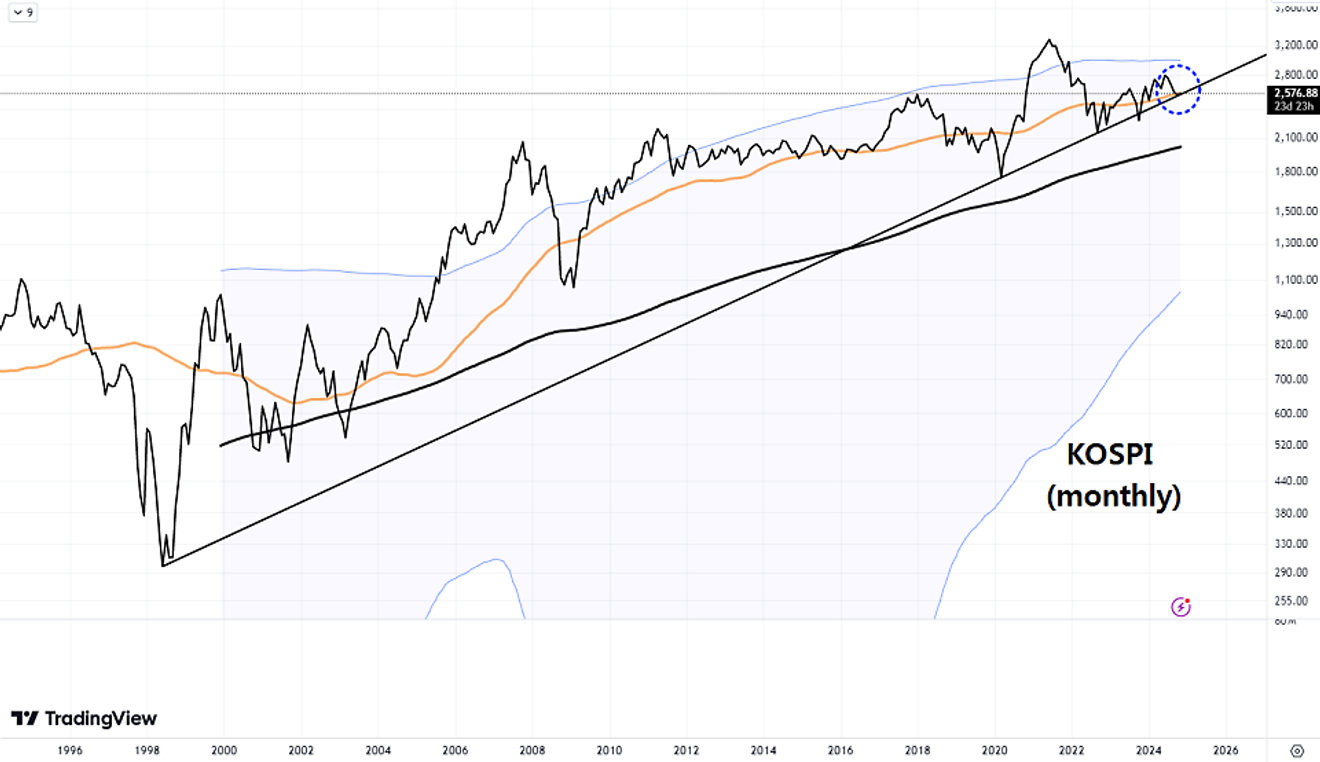
Below is the current position of the KOSPI index on a monthly candlestick chart, showing the monthly closing prices. It seems to be at a position that might have some significance, doesn't it?
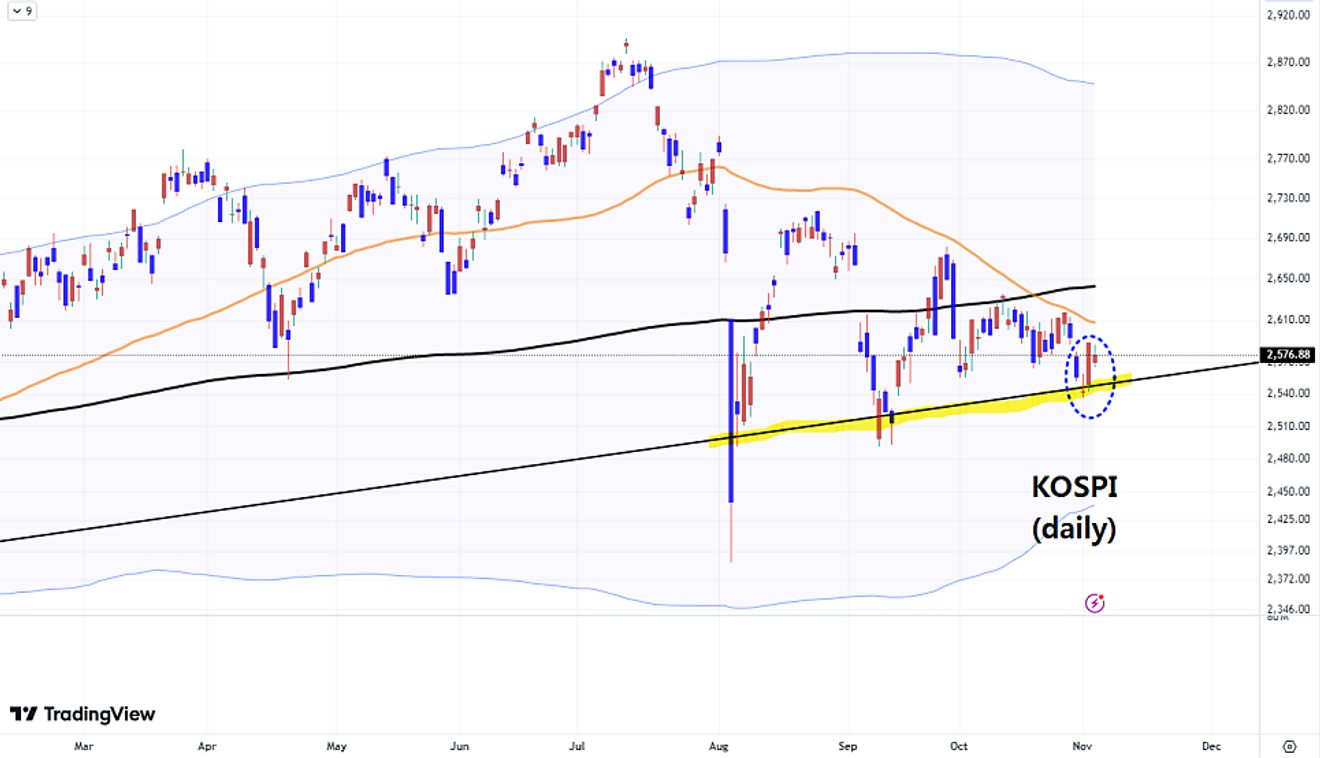
The KOSPI index chart, zoomed in to a daily candlestick chart, is shown below.
In early August, during the yen carry trade unwinding issue, the Japanese stock market and KOSPI experienced a sharp drop. Since then, it has been fluctuating around the medium- to long-term trend line seen in the monthly chart.
From the daily chart, if there were no issues that immediately cause the line to break, yesterday was a position that needed support. The FIST news yesterday morning seems to have provided short-term fuel to this trend.
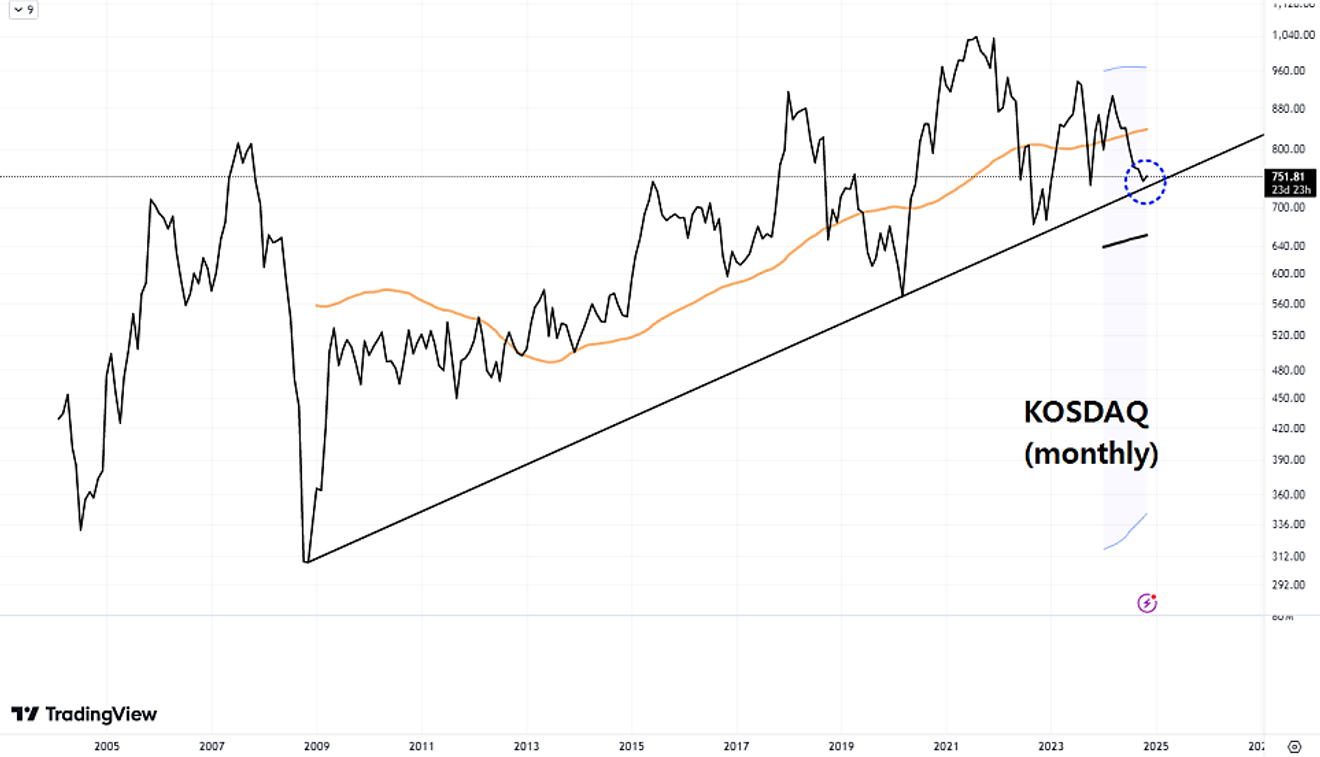
Now, let's look at the trend of the KOSDAQ index. Below is the monthly chart of the KOSDAQ Composite Index, based on monthly closing prices, similar to the previous chart.
It feels like it's in a similar position to the KOSPI index's monthly chart, doesn't it?
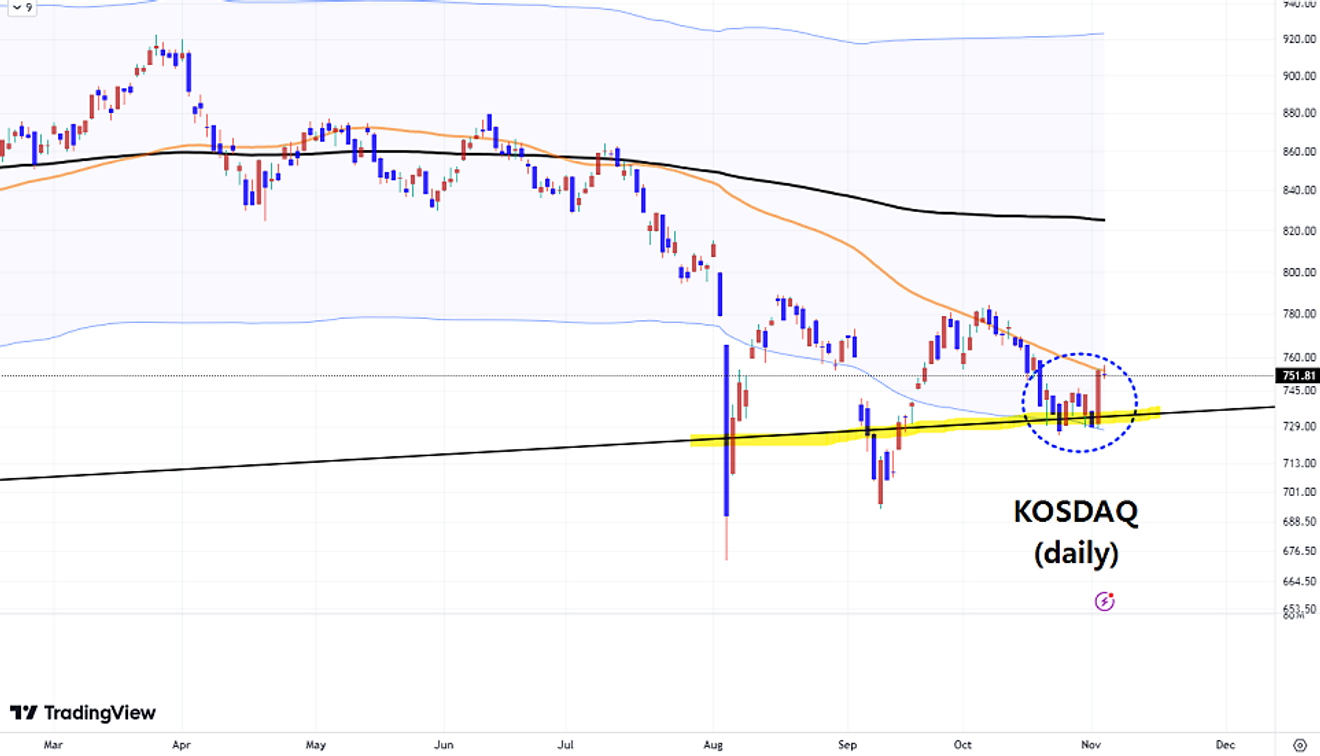
Even when viewed on a daily chart, it shows a similar trend to the KOSPI index at a similar position.
Unless there are causes or issues that strongly break the current positions of both KOSPI and KOSDAQ, it can be seen that they are still at positions that need to hold. Will both KOSPI and KOSDAQ finally find their bottom and start to rise from here?
Given the characteristics of the domestic stock market, this will likely be determined by the trend of the US stock market.
If the US stock market continues its upward trend after the US presidential election and the FOMC meeting without any major problems, the domestic stock market will likely find its bottom around this point. However, if the opposite happens, the domestic stock market will continue to fall below the support line mentioned above.
Ultimately, it seems correct to conclude that the domestic stock market depends not on the FIST, but on the upcoming trend of the US stock market.
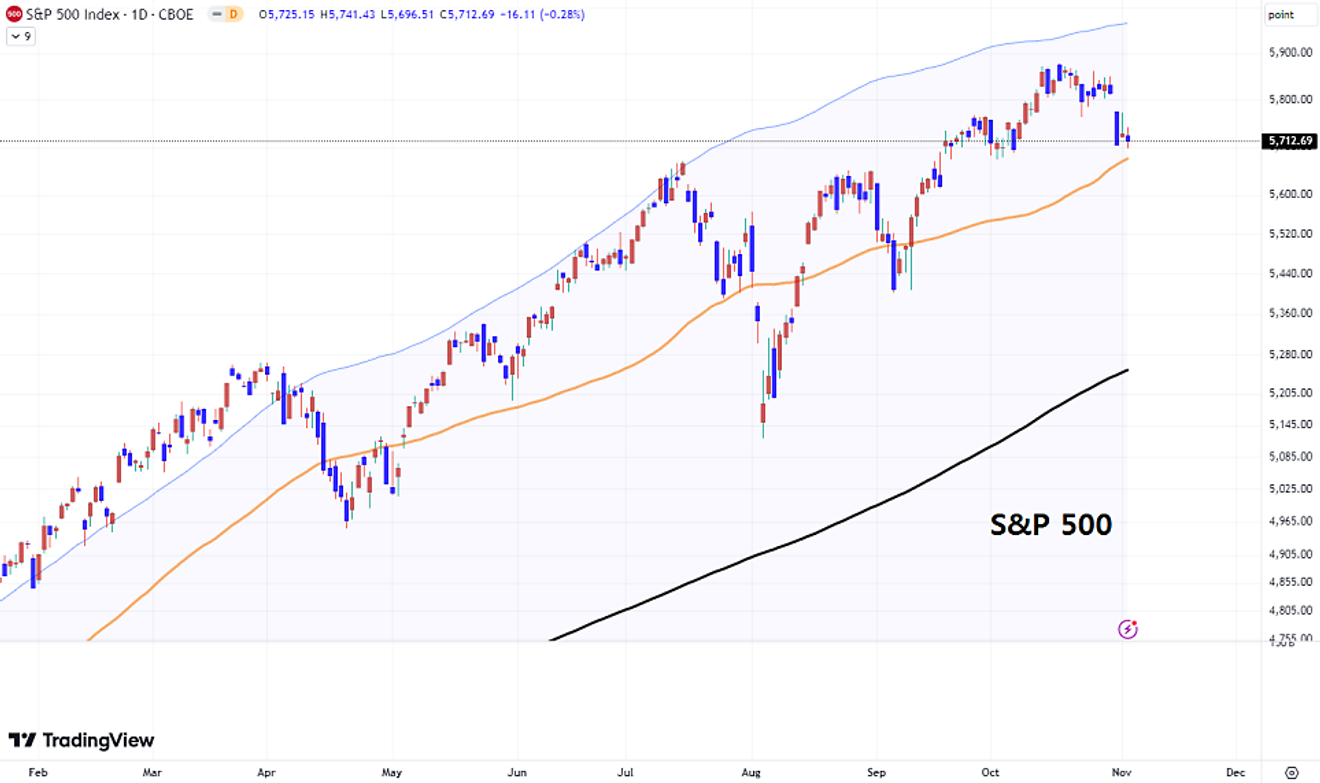
Comparing this with the content of the previous article, which briefly examines the current position of the US stock market, it seems that for the domestic stock market to recover from its current position, the US stock market needs to show a significant jump driven by AI-related stock bubbles.
If the opposite occurs, it will fall below the support line, leading to a further decline in the level of the domestic stock market.
- How Long Will the Nasdaq's Long-Term Outperformance in the US Stock Market Continue, or Is It Changing Now?
- This article analyzes whether the Nasdaq's dominance in the US stock market will continue. By examining the ratio of the Nasdaq index to the Dow Jones index, it explains the adjustment phase since the peak in late 2021, and mentions technical analysis and
Comments0