- How Long Will the Nasdaq's Long-Term Outperformance in the US Stock Market Continue, or Is It Changing Now?
- This article analyzes whether the Nasdaq's dominance in the US stock market will continue. By examining the ratio of the Nasdaq index to the Dow Jones index, it explains the adjustment phase since the peak in late 2021, and mentions technical analysis and

The title and content of this post are not meant to suggest that the upcoming US presidential election on November 5, 2024 (today), was predicted in advance. Rather, it reflects my personal opinion based on the current trends in the US stock market and other market indicators.
In a previous post, we examined a monthly chart showing the relative ratio of the NASDAQ 100 index to the Dow Jones Industrial Average.
In this chart, point A, at the end of 2021, marked the first time the index reached the same high as during the dot-com bubble of 2000. Let's call the current area around 2024 point B.
Point A, at the end of 2021, was a point I had personally anticipated as a crucial pivot point (or benchmark) for the US stock market from the perspective of my long-held "Second Great Depression Hypothesis".
In the context of the US stock market, a pivot point signifies a location where the long-term bull market, which has continued uninterrupted since the 2008 global financial crisis, "at least pauses, or could even represent a long-term high." This is my own term.
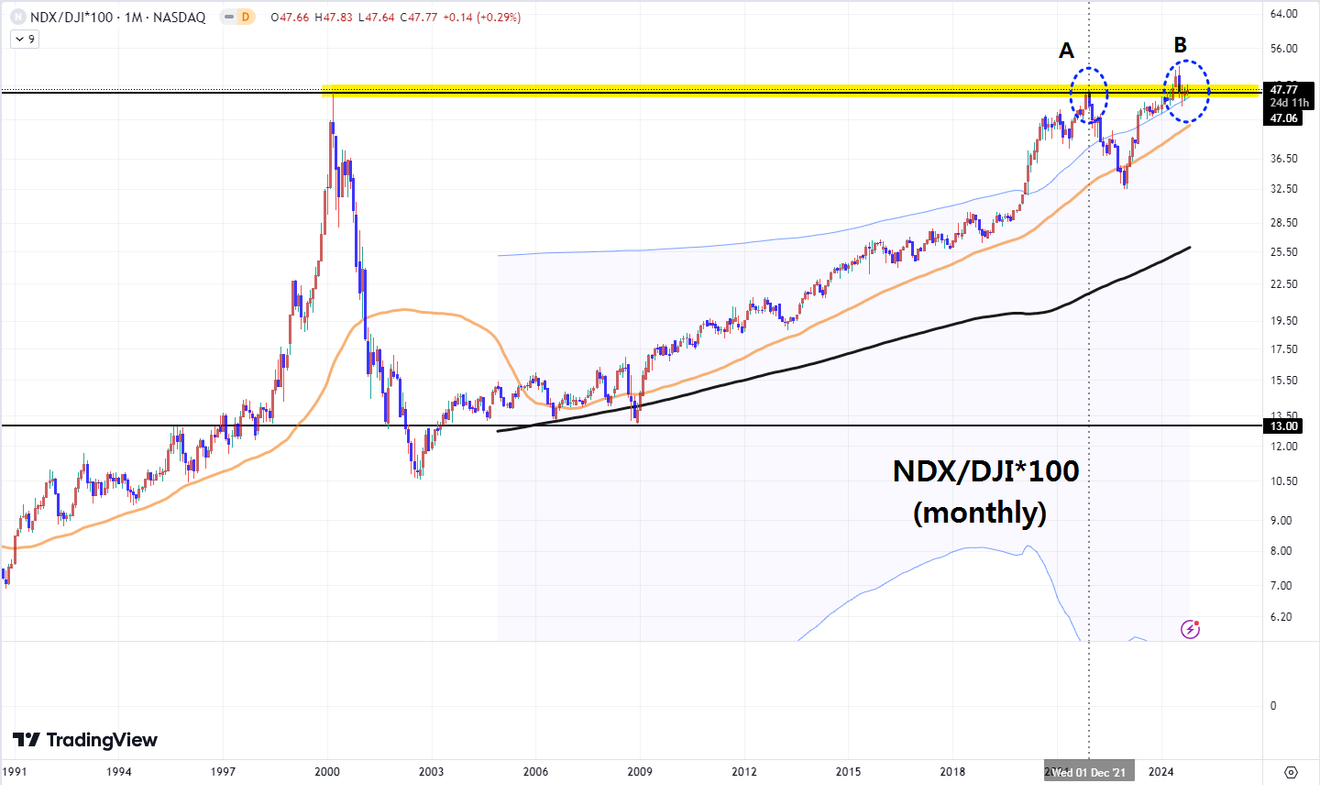
NDX/DJI*100, monthly
The reason I believed this point at the end of 2021 would mark at least a temporary pause in the bull market since 2008 wasn't solely because the NDX/DJI chart met the previous dot-com bubble high. It was more because I was watching indices like the Dow Jones and S&P 500, anticipating that "at least a correction, if not a pause in the uptrend," would likely occur near those index levels.
At that time, I didn't consider the NDX/DJI ratio to be particularly important, but seeing it reach the dot-com bubble high made me think that this position might also have significant meaning.
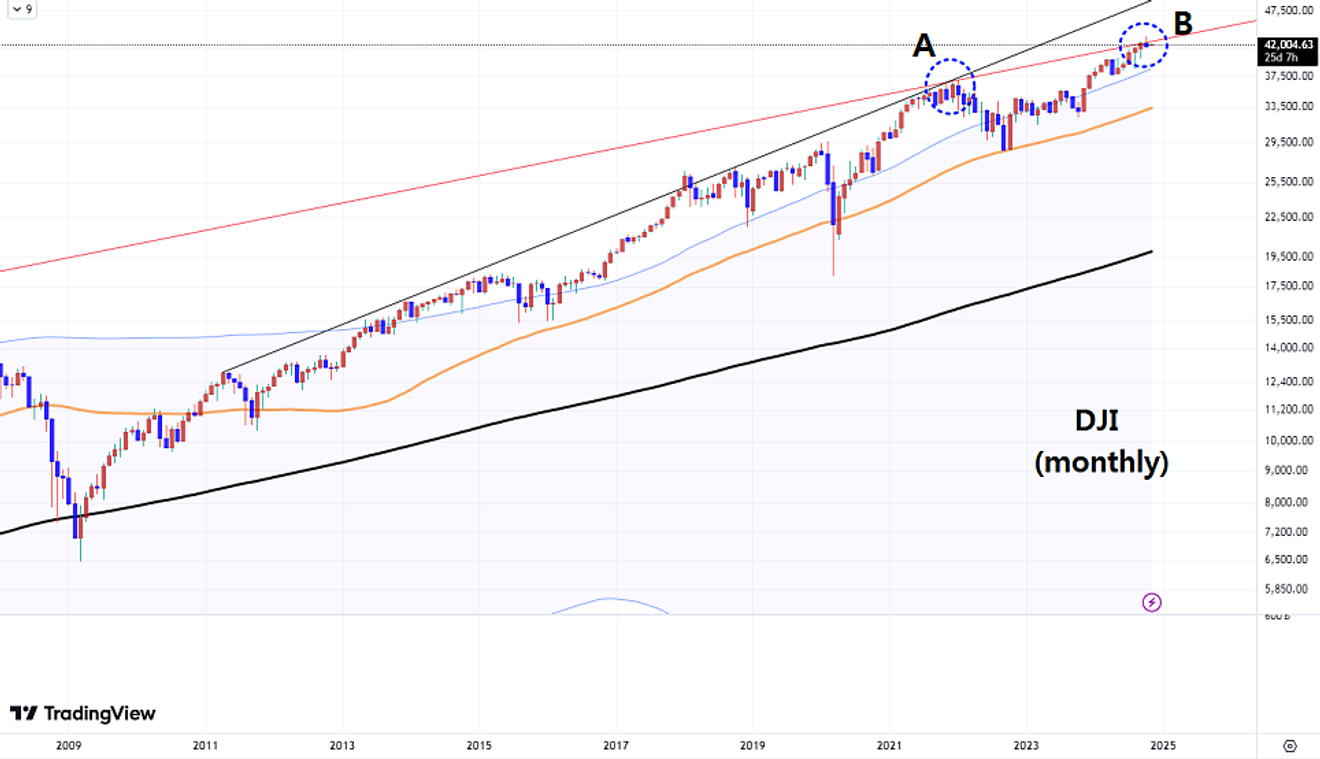
DJI, monthly
The location of point A, after the global financial crisis, appears to be a similar technical position in the S&P 500 index shown below, as well as in the NDXE, the equally weighted average index of the NASDAQ 100, in addition to the Dow Jones Industrial Average shown above.
In my hypothesis, the significance of point A wasn't simply that it reached the trend line, as shown in the charts above, but also because "it reached that index level." The index level reached at the end of 2021 was separately calculated, albeit approximately.
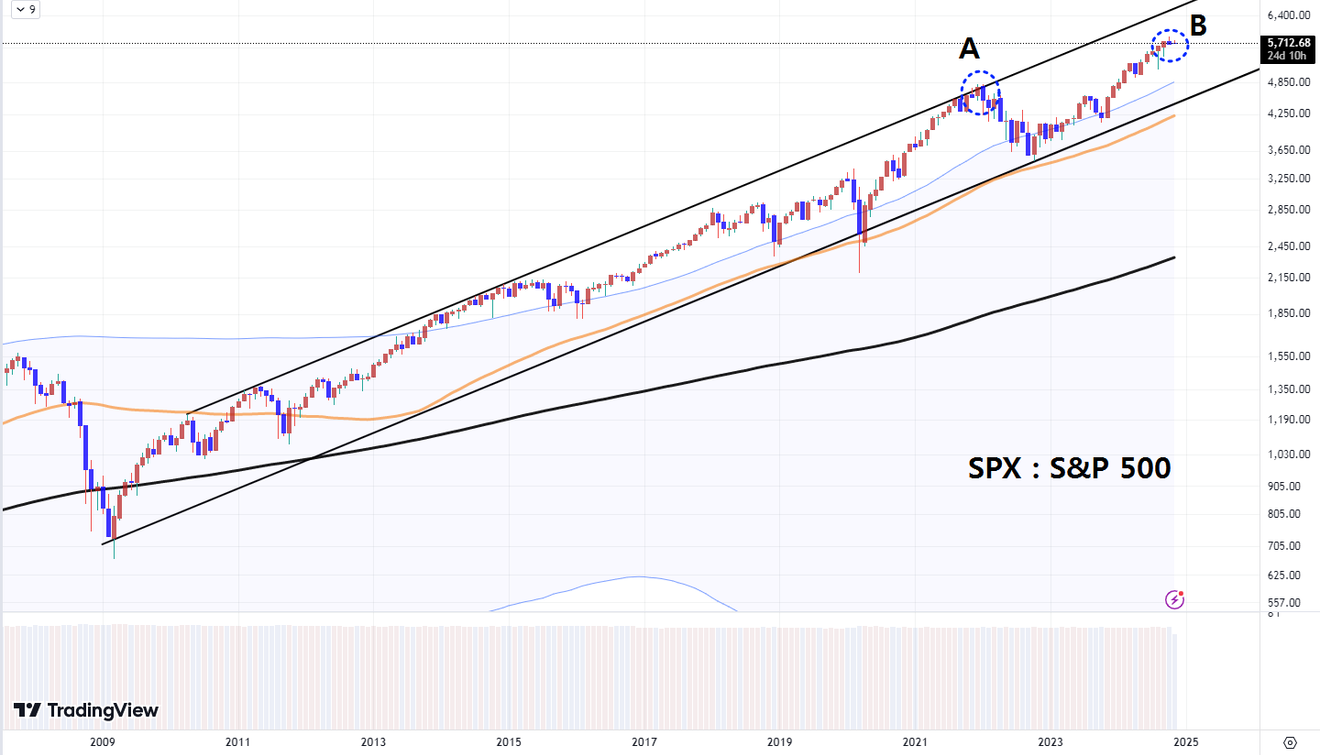
SPX, monthly
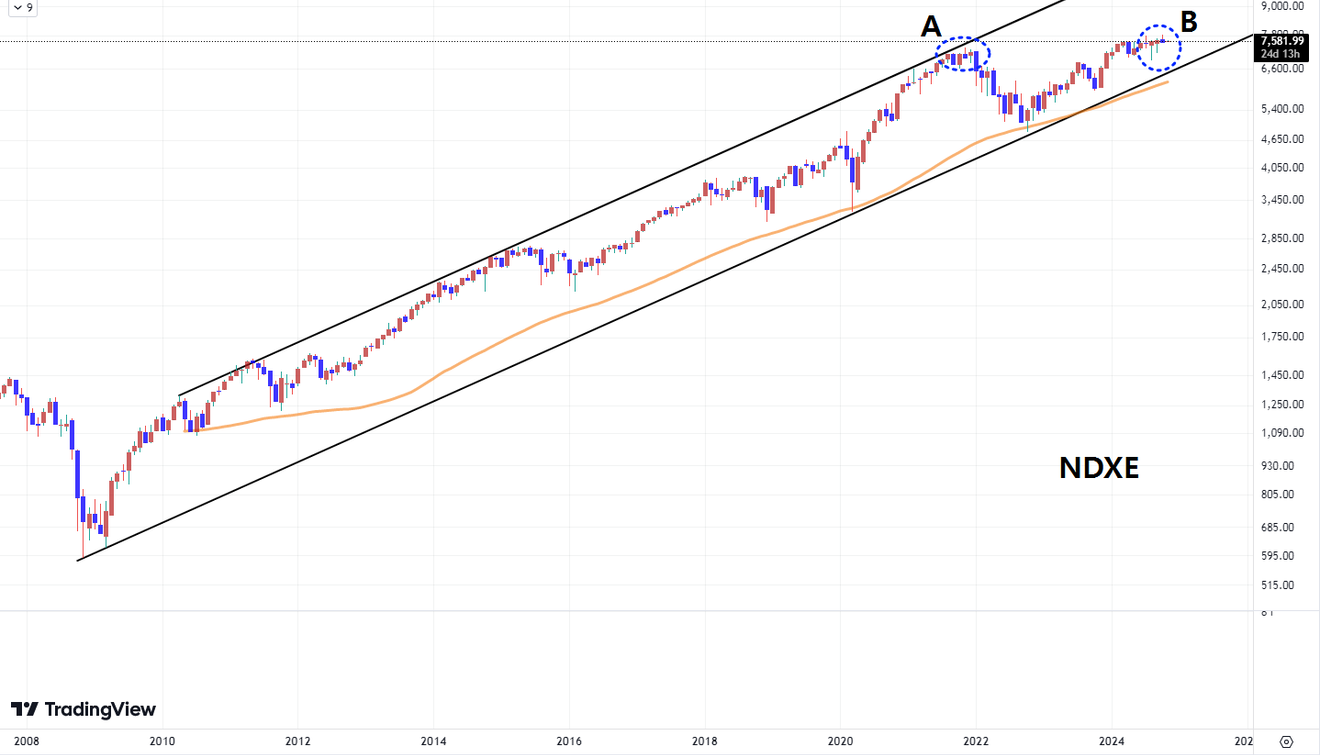
NDXE, monthly
Comparing point A, marked as the end of 2021, with the Dow Jones Industrial Average during the Great Depression, which began in 1929, suggests that it might have a similar significance to the position in early September 1929.
However, in 1929, after nearly a decade of a long and strong bull market, the market created a high as "a single peak" in September 1929, immediately transitioning into a long bear market.
This is crucial. In 1929, the market technically reversed direction as a "single peak" or "single top," which is not a common occurrence technically.
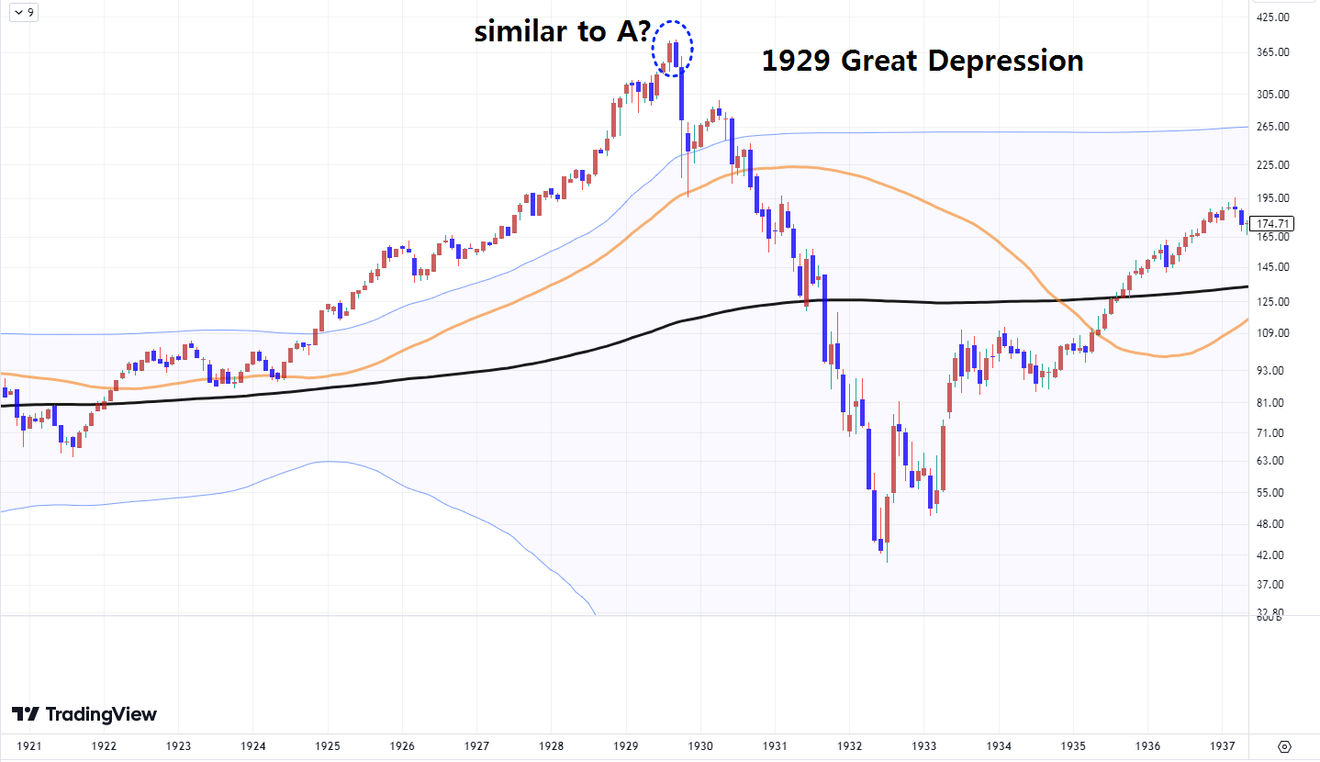
DJI, monthly
After a strong upward trend, markets often create more peaks to gradually slow the previous upward momentum and reverse direction. When there are two peaks, it's called a "double top," and when there are three, it's called a "triple top."
When the direction changes after a strong uptrend, it's more common to see a double top or triple top formation than an immediate reversal at a single peak. Although a double top is the most frequently observed high formation pattern.
Those familiar with technical analysis will generally know that in both double top and triple top patterns, the second peak is typically the highest.
Below is a monthly chart of the NASDAQ 100 index, which has led the US stock market since 2008. As a market-cap-weighted average index, it is heavily influenced by the price movements of M7 and other big tech companies.
This index, similar to others, paused at its overheated high point at the end of 2021 and is now passing point B. It has been facing resistance at the upper channel trendline for several months.
This resistance began in July when "artificial intelligence skepticism" started gaining traction in Wall Street media. It suggests a possible interconnected trend.
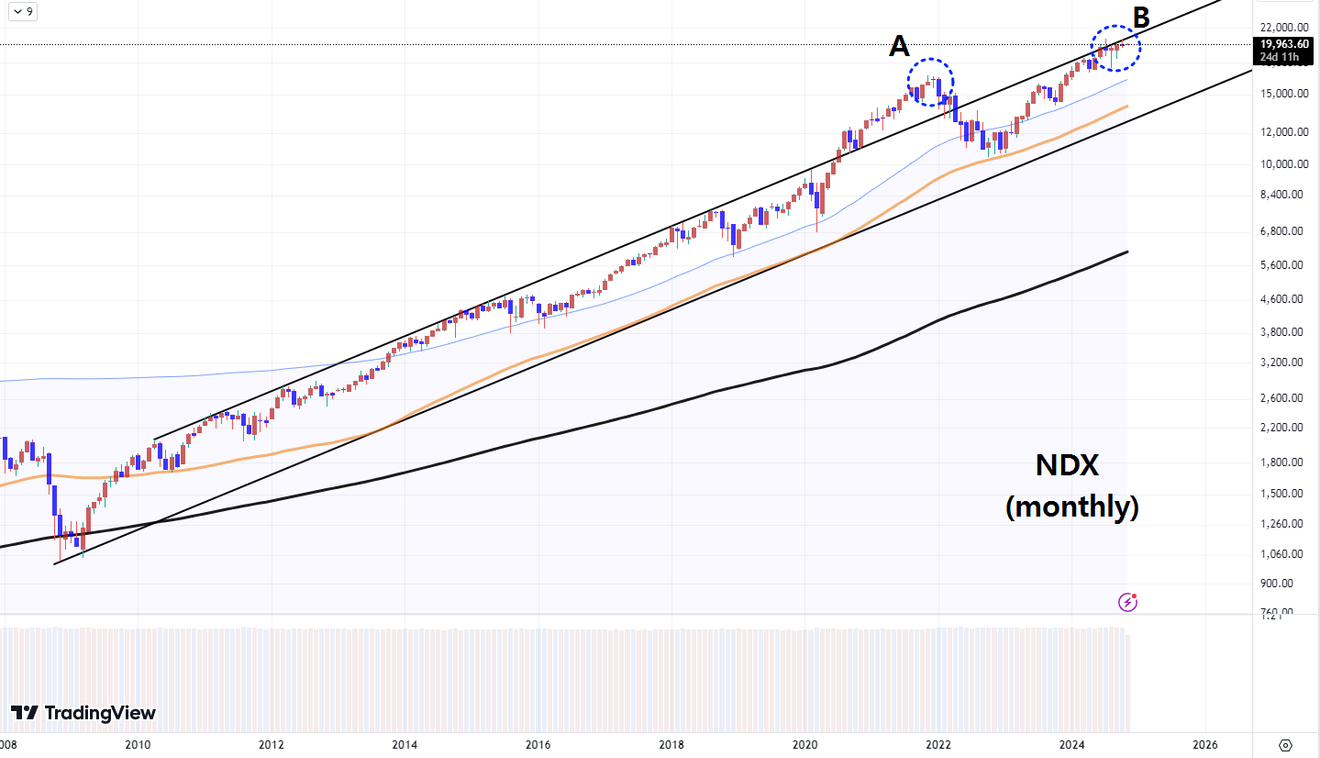
NDX, monthly
Let's examine the section between A and B in the monthly chart above with a weekly chart for a closer look.
In summary, the flow between these points, as I anticipate it, is shown briefly below. I've drawn it as an a-b-c wave pattern, reflecting my expectation that point B, although higher than point A in terms of index level, represents a technically "equivalent" high. This is a continuation pattern at a high price, or what some call "high-price play."
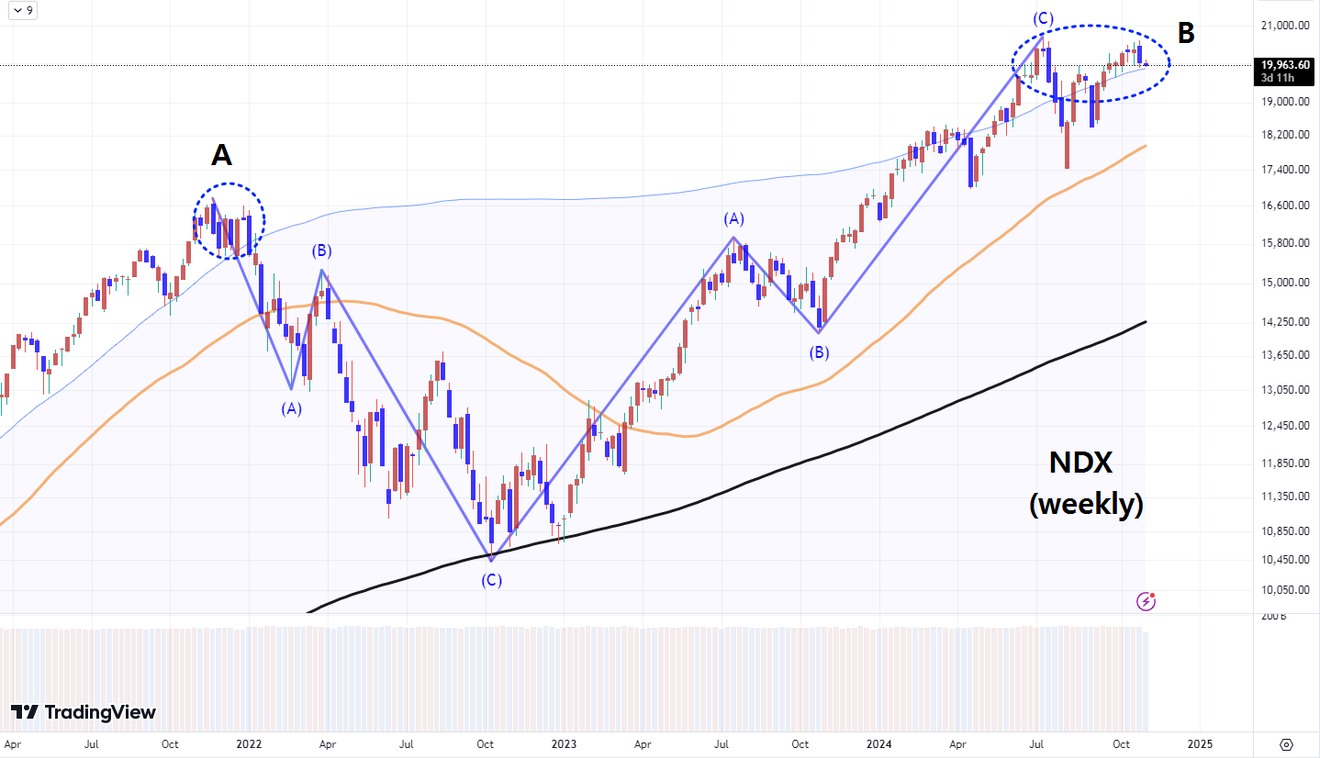
NDX, monthly
In the chart above, I've only drawn up to the second a-b-c wave until July. This is because I believe that since July, this sideways a-b-c wave has been repeating itself on a smaller scale, proceeding fractally, as shown in the daily chart below.
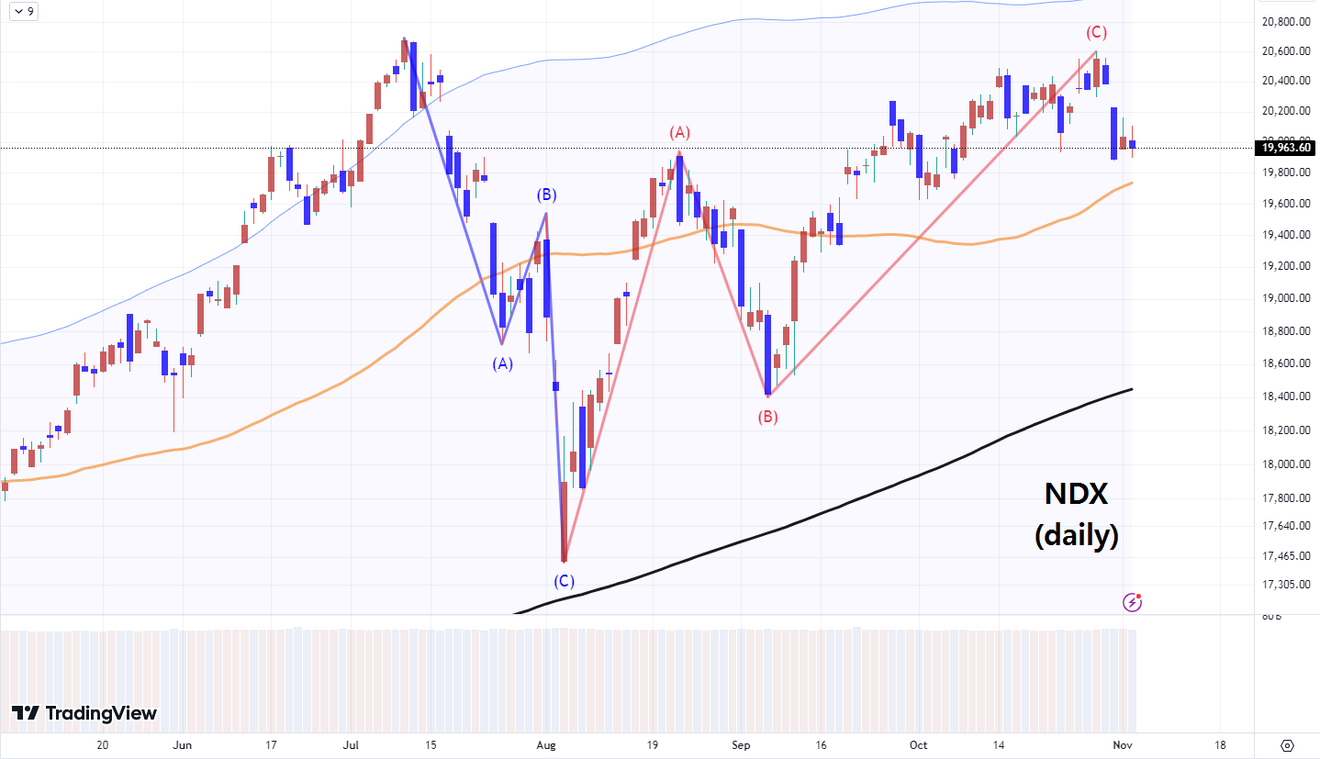
NDX, daily
So, why did I mention in the title that the high point in October or November might be a long-term high? Because this small wave pattern in the daily chart also shows signs of ending.
The chart below, with a couple of added trend lines, might better illustrate my point.
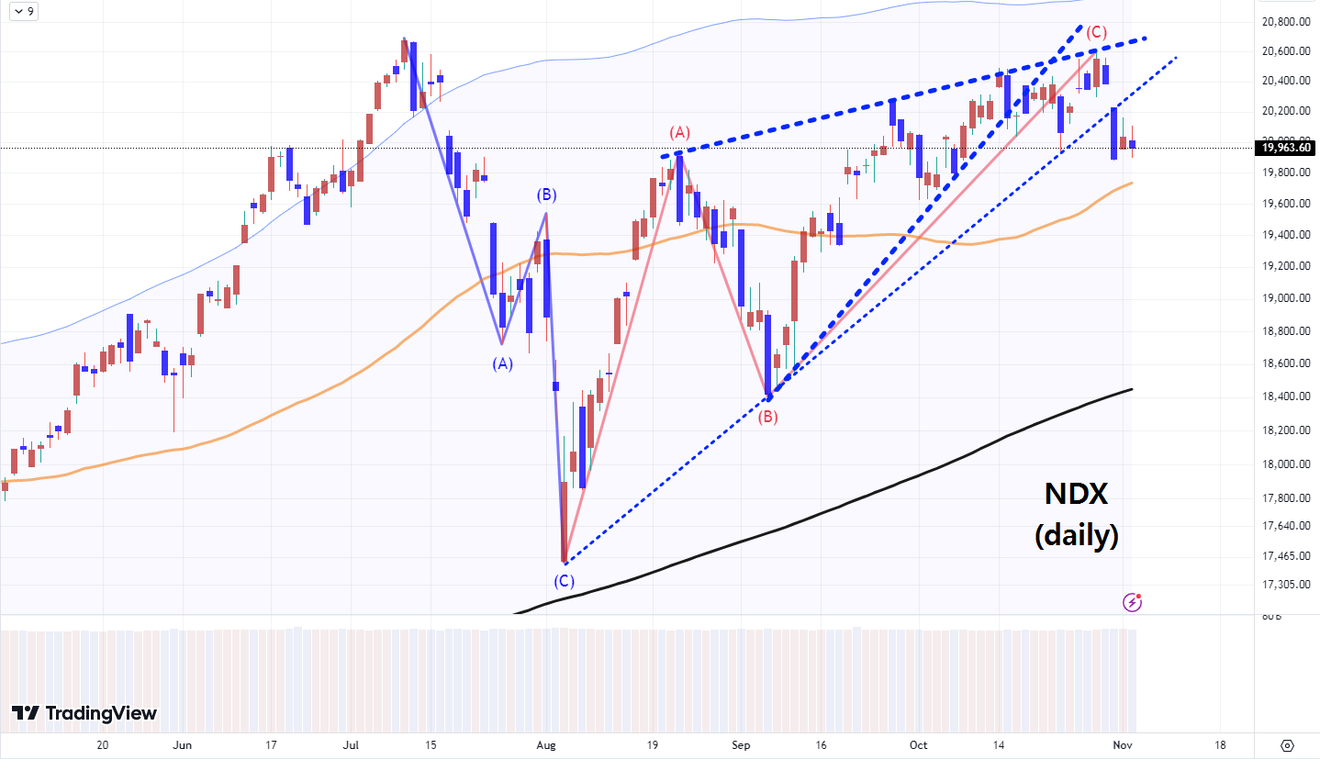
NDX, daily
Similar patterns can be observed in the daily charts of the Dow Jones Industrial Average and the S&P 500 index until October. Short-term trends are showing changes.
However, the difference is that for the NASDAQ, heavily influenced by big tech, the July high was stronger, while for the Dow Jones, less influenced by big tech due to its equally weighted average, the October high was stronger (higher).
The S&P 500 index, with a characteristic somewhere between the NASDAQ and the Dow, had a higher October high than July, but the prices of the most important big tech companies in the US stock market have remained stagnant since July. If big tech stocks don't recover strongly, the indices are likely to weaken and continue this trend.
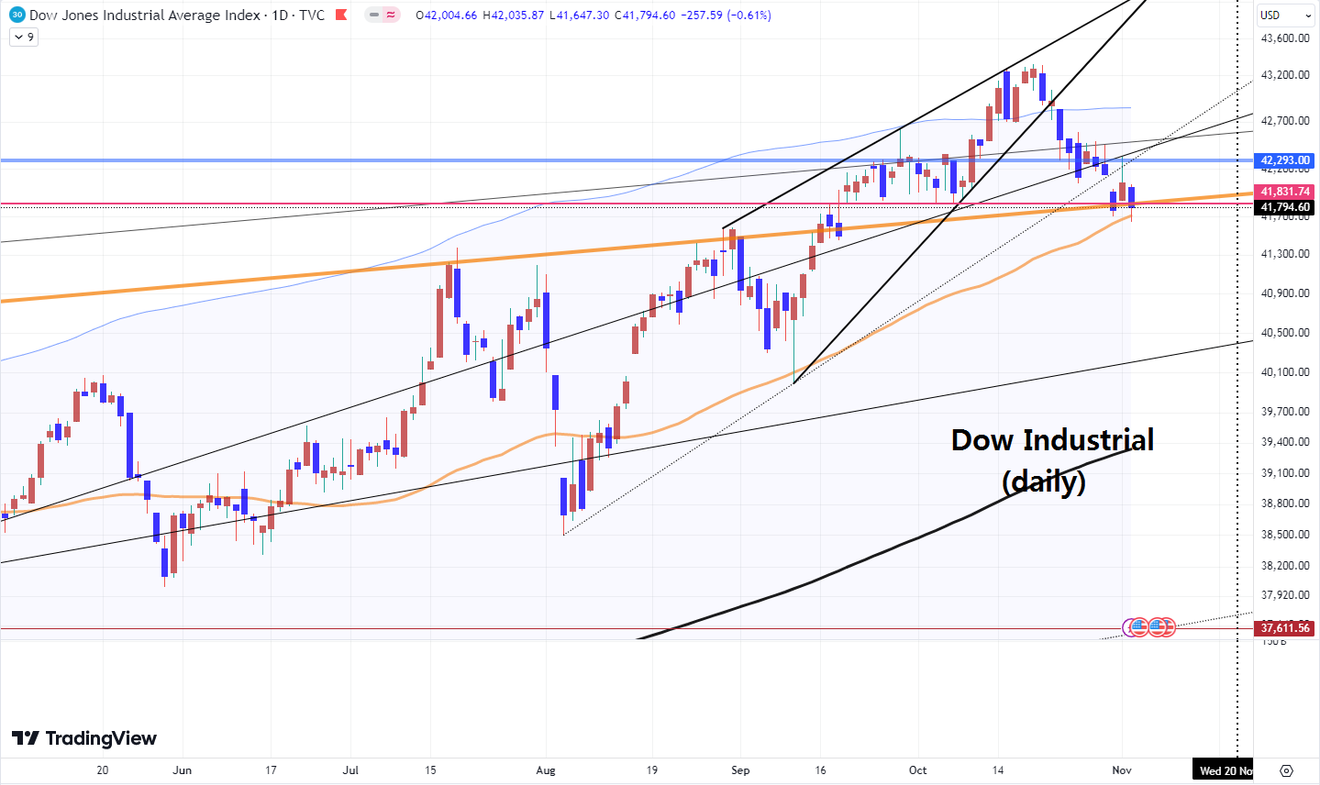
DJI, daily
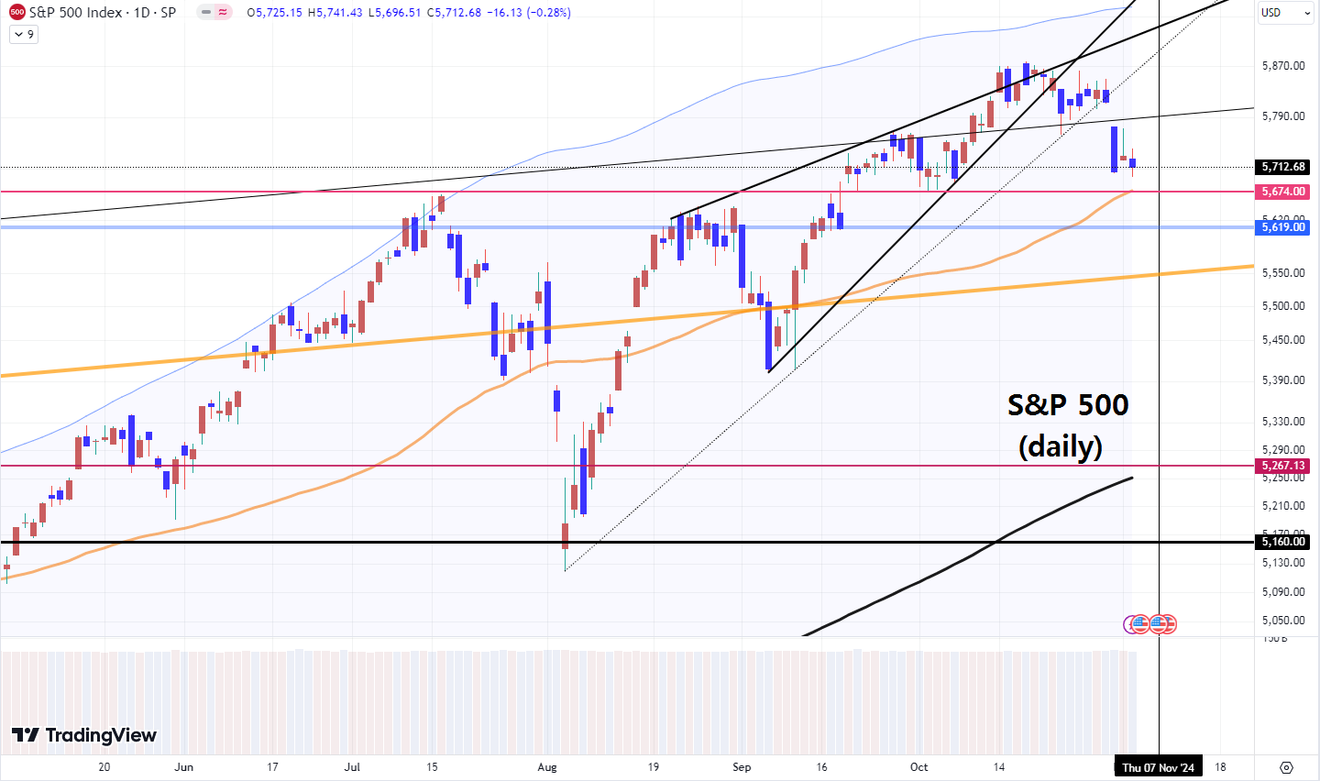
SPX, daily
Looking at the Dow Jones and S&P 500 indices, the October high is higher, but looking at the tech-heavy NASDAQ index or the Philadelphia Semiconductor Index below, if the US stock market does not immediately renew its high, the July high will likely remain higher than October or November.
The peak location between July and October, or even the remaining November, may differ slightly depending on the major indices. As a time lag appears between sectors, the composite index like the S&P 500 is creating a sideways range.
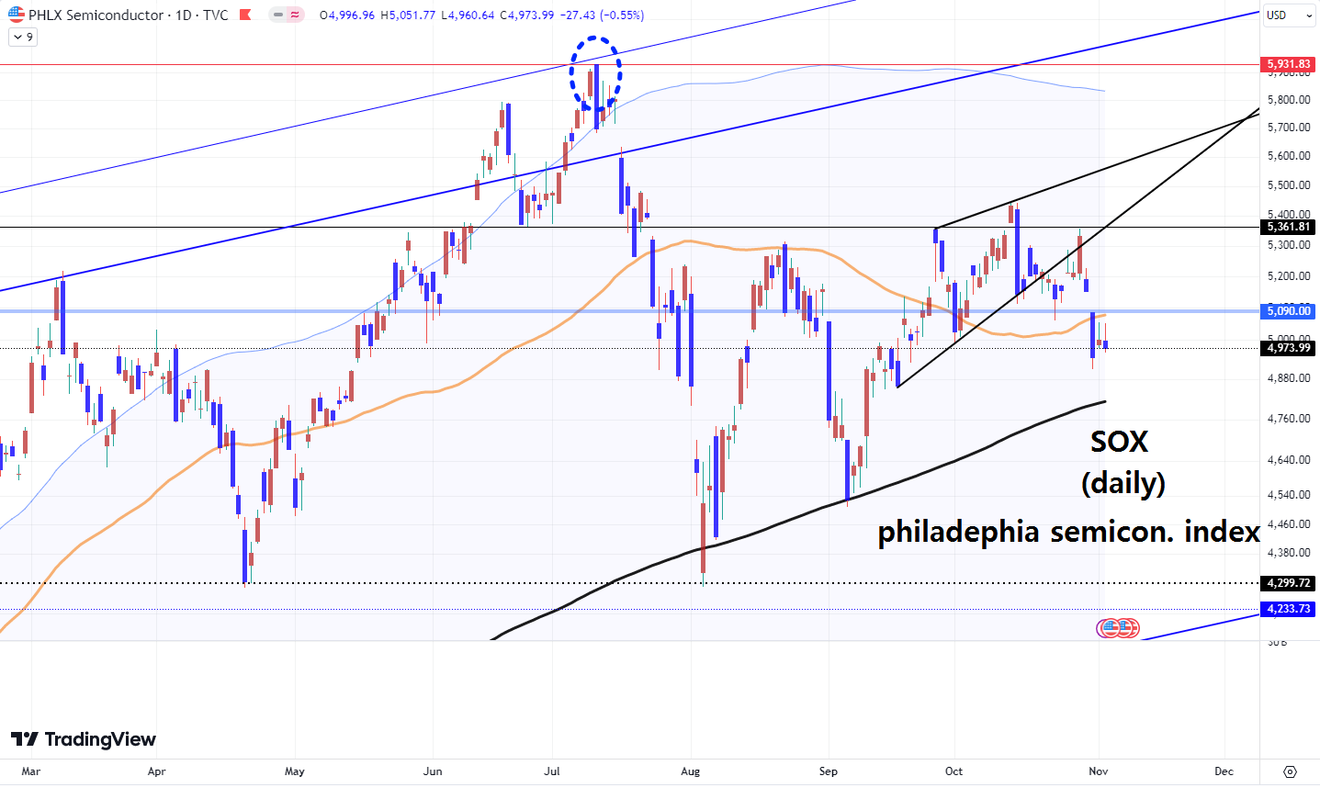
SOX, daily
I posted the previous post in advance because I believed similar patterns were emerging across all three major US indices.
Therefore, I believe a significant trend in the US stock market is developing now, particularly around the US presidential election. We'll have to keep a close watch on the trend until the end of the year, at least, won't we?
- [Trends and Patterns] Reversal Chart Flow Attempting to Conceal the Persistence of Direction - Wedge Pattern
- The wedge pattern is a chart pattern that foreshadows a reversal in stock price movements. An ascending wedge suggests a potential downward reversal, while a descending wedge suggests a potential upward reversal. It often appears in the c-wave of an a-b-c
Comments0